Explorer Page Monitoring
You can also use LUKSO's official explorer webpages to monitor your nodes or validator status without relying directly on your local metrics. It's one of the most efficient methods and does not require any login to work. Their links can be verified at the Mainnet Parameter and Testnet Parameter sections of the official LUKSO Tech Docs page.
7.8.1 Execution Block Explorer
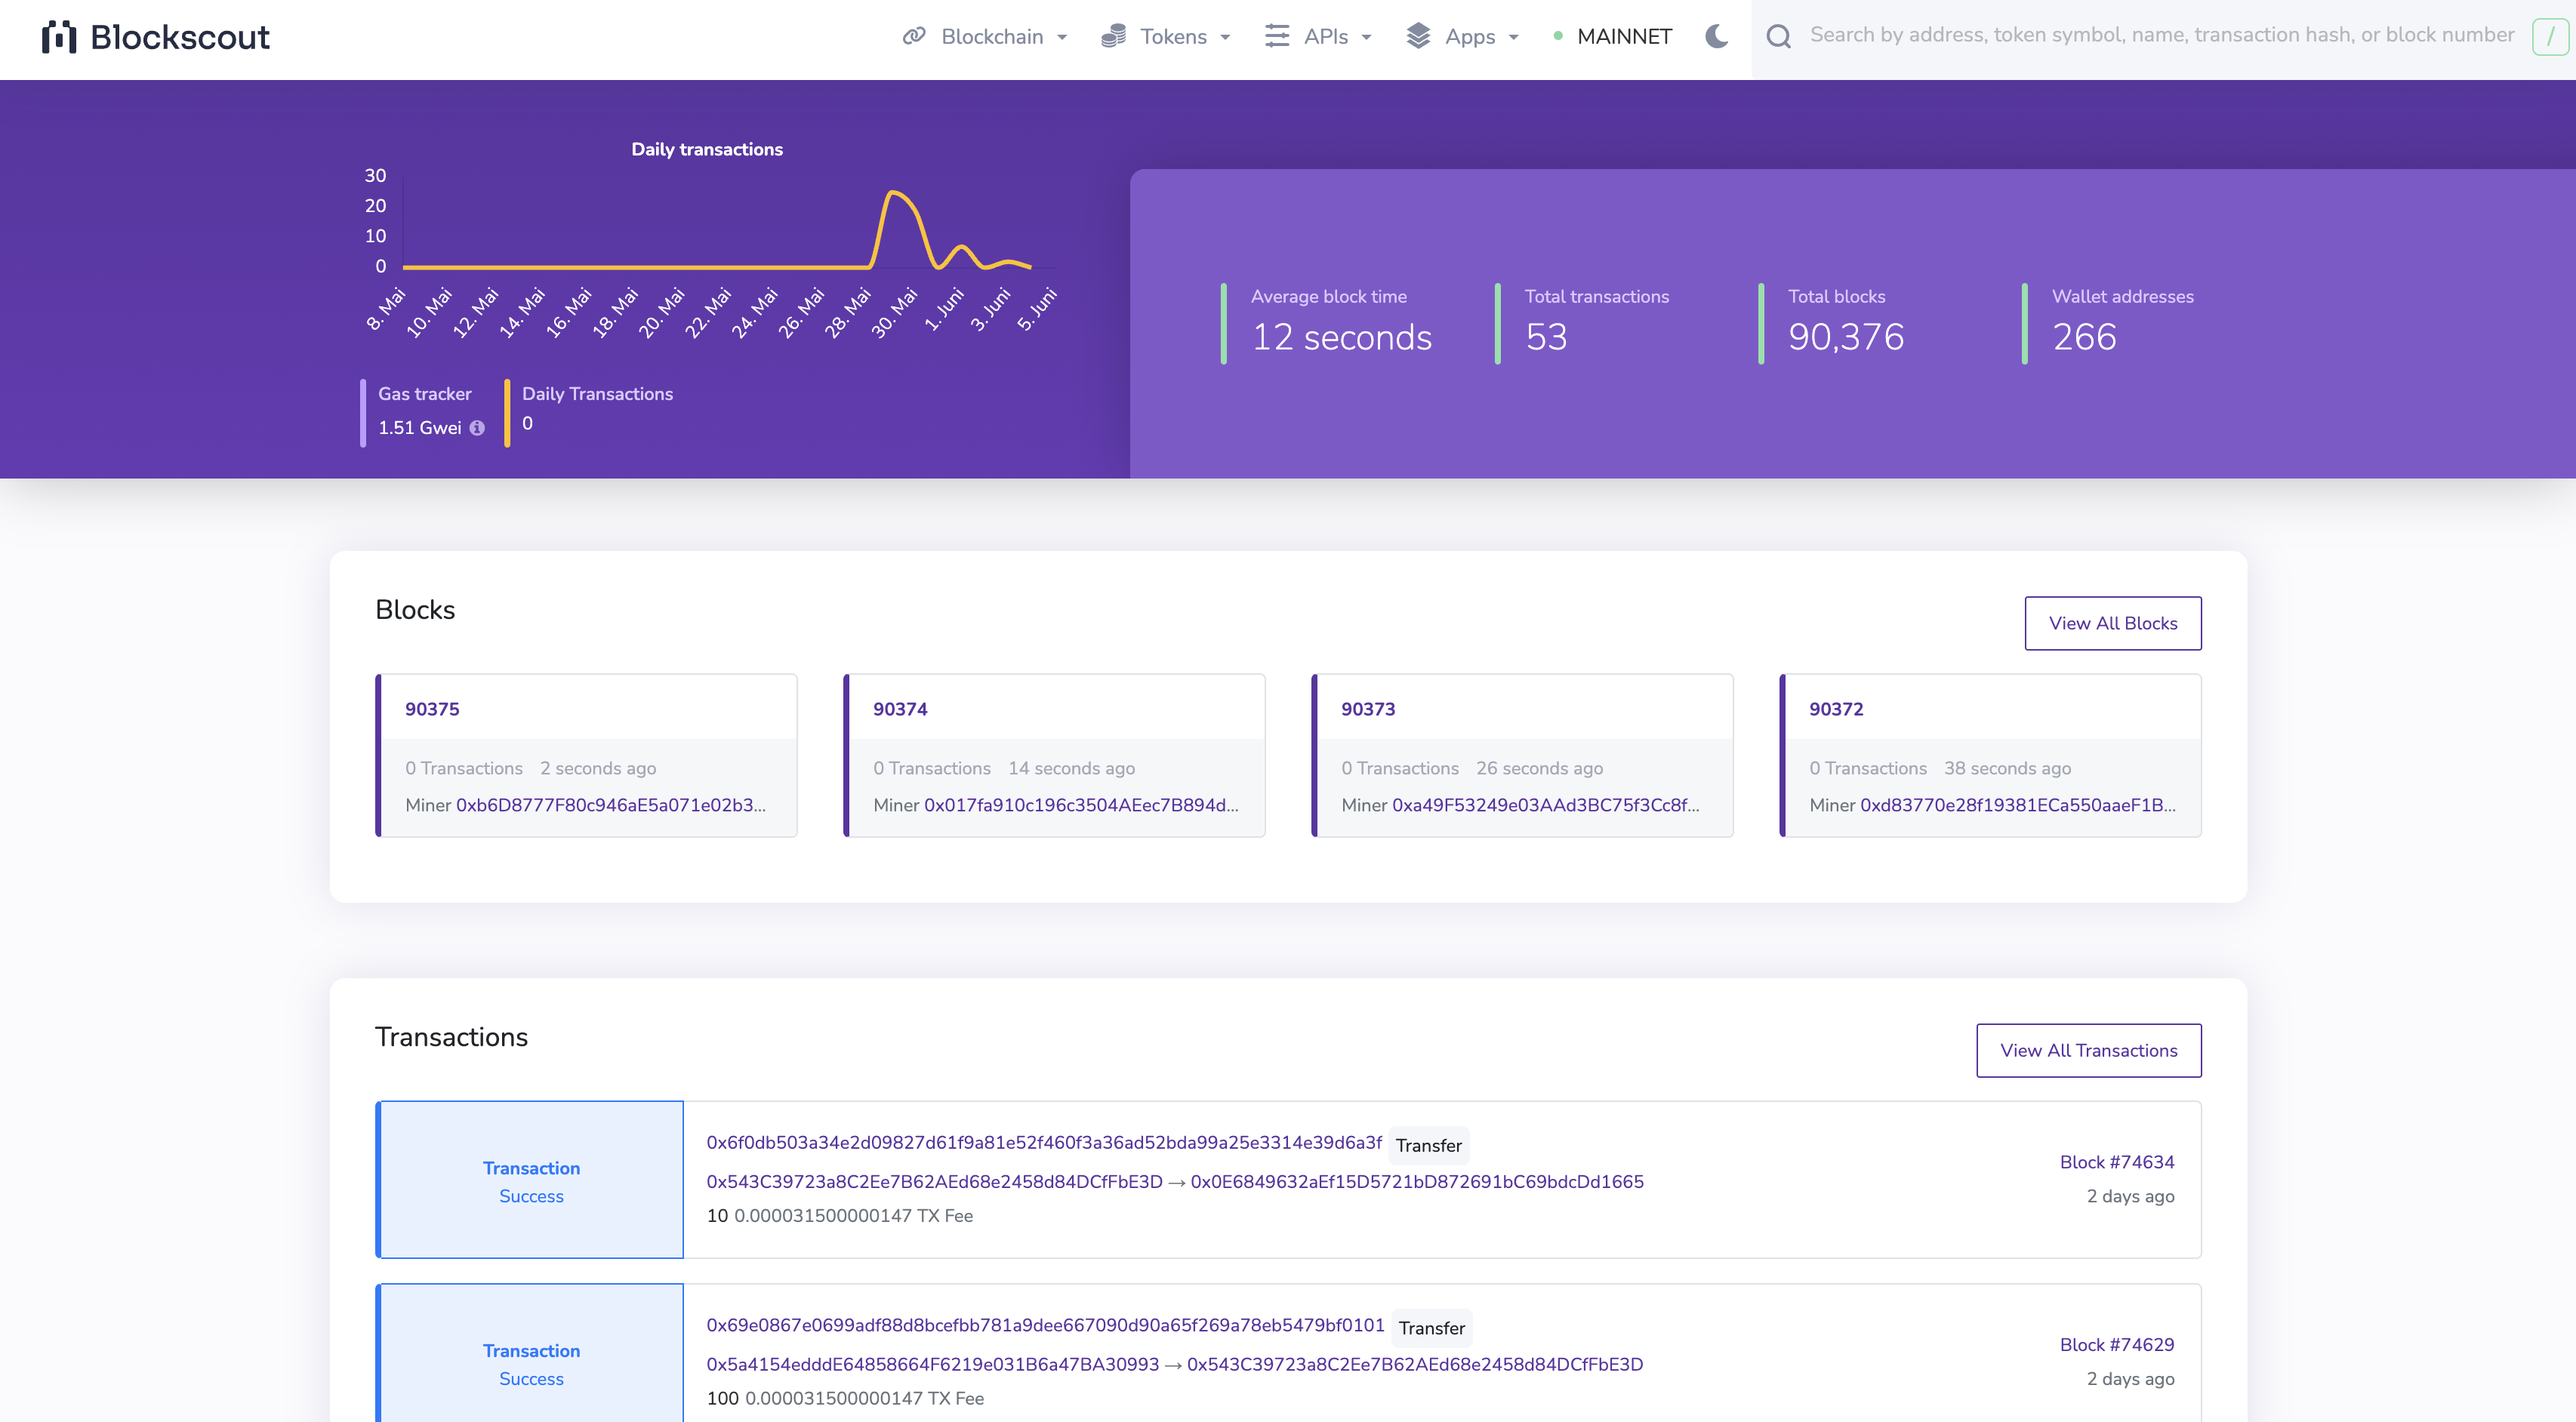
The Execution Block Explorer is a valuable tool for examining your blockchain's detailed transactions and blocks. It provides information about who validated the blocks and the number of blocks your validator has validated. It also displays the balance of the transaction recipient's fees addresses. With the aid of the Execution Block Explorer, you can maintain a comprehensive understanding of your transactional environment, ensuring the continued smooth operation of your blockchain network.
7.8.2 Execution Status Page
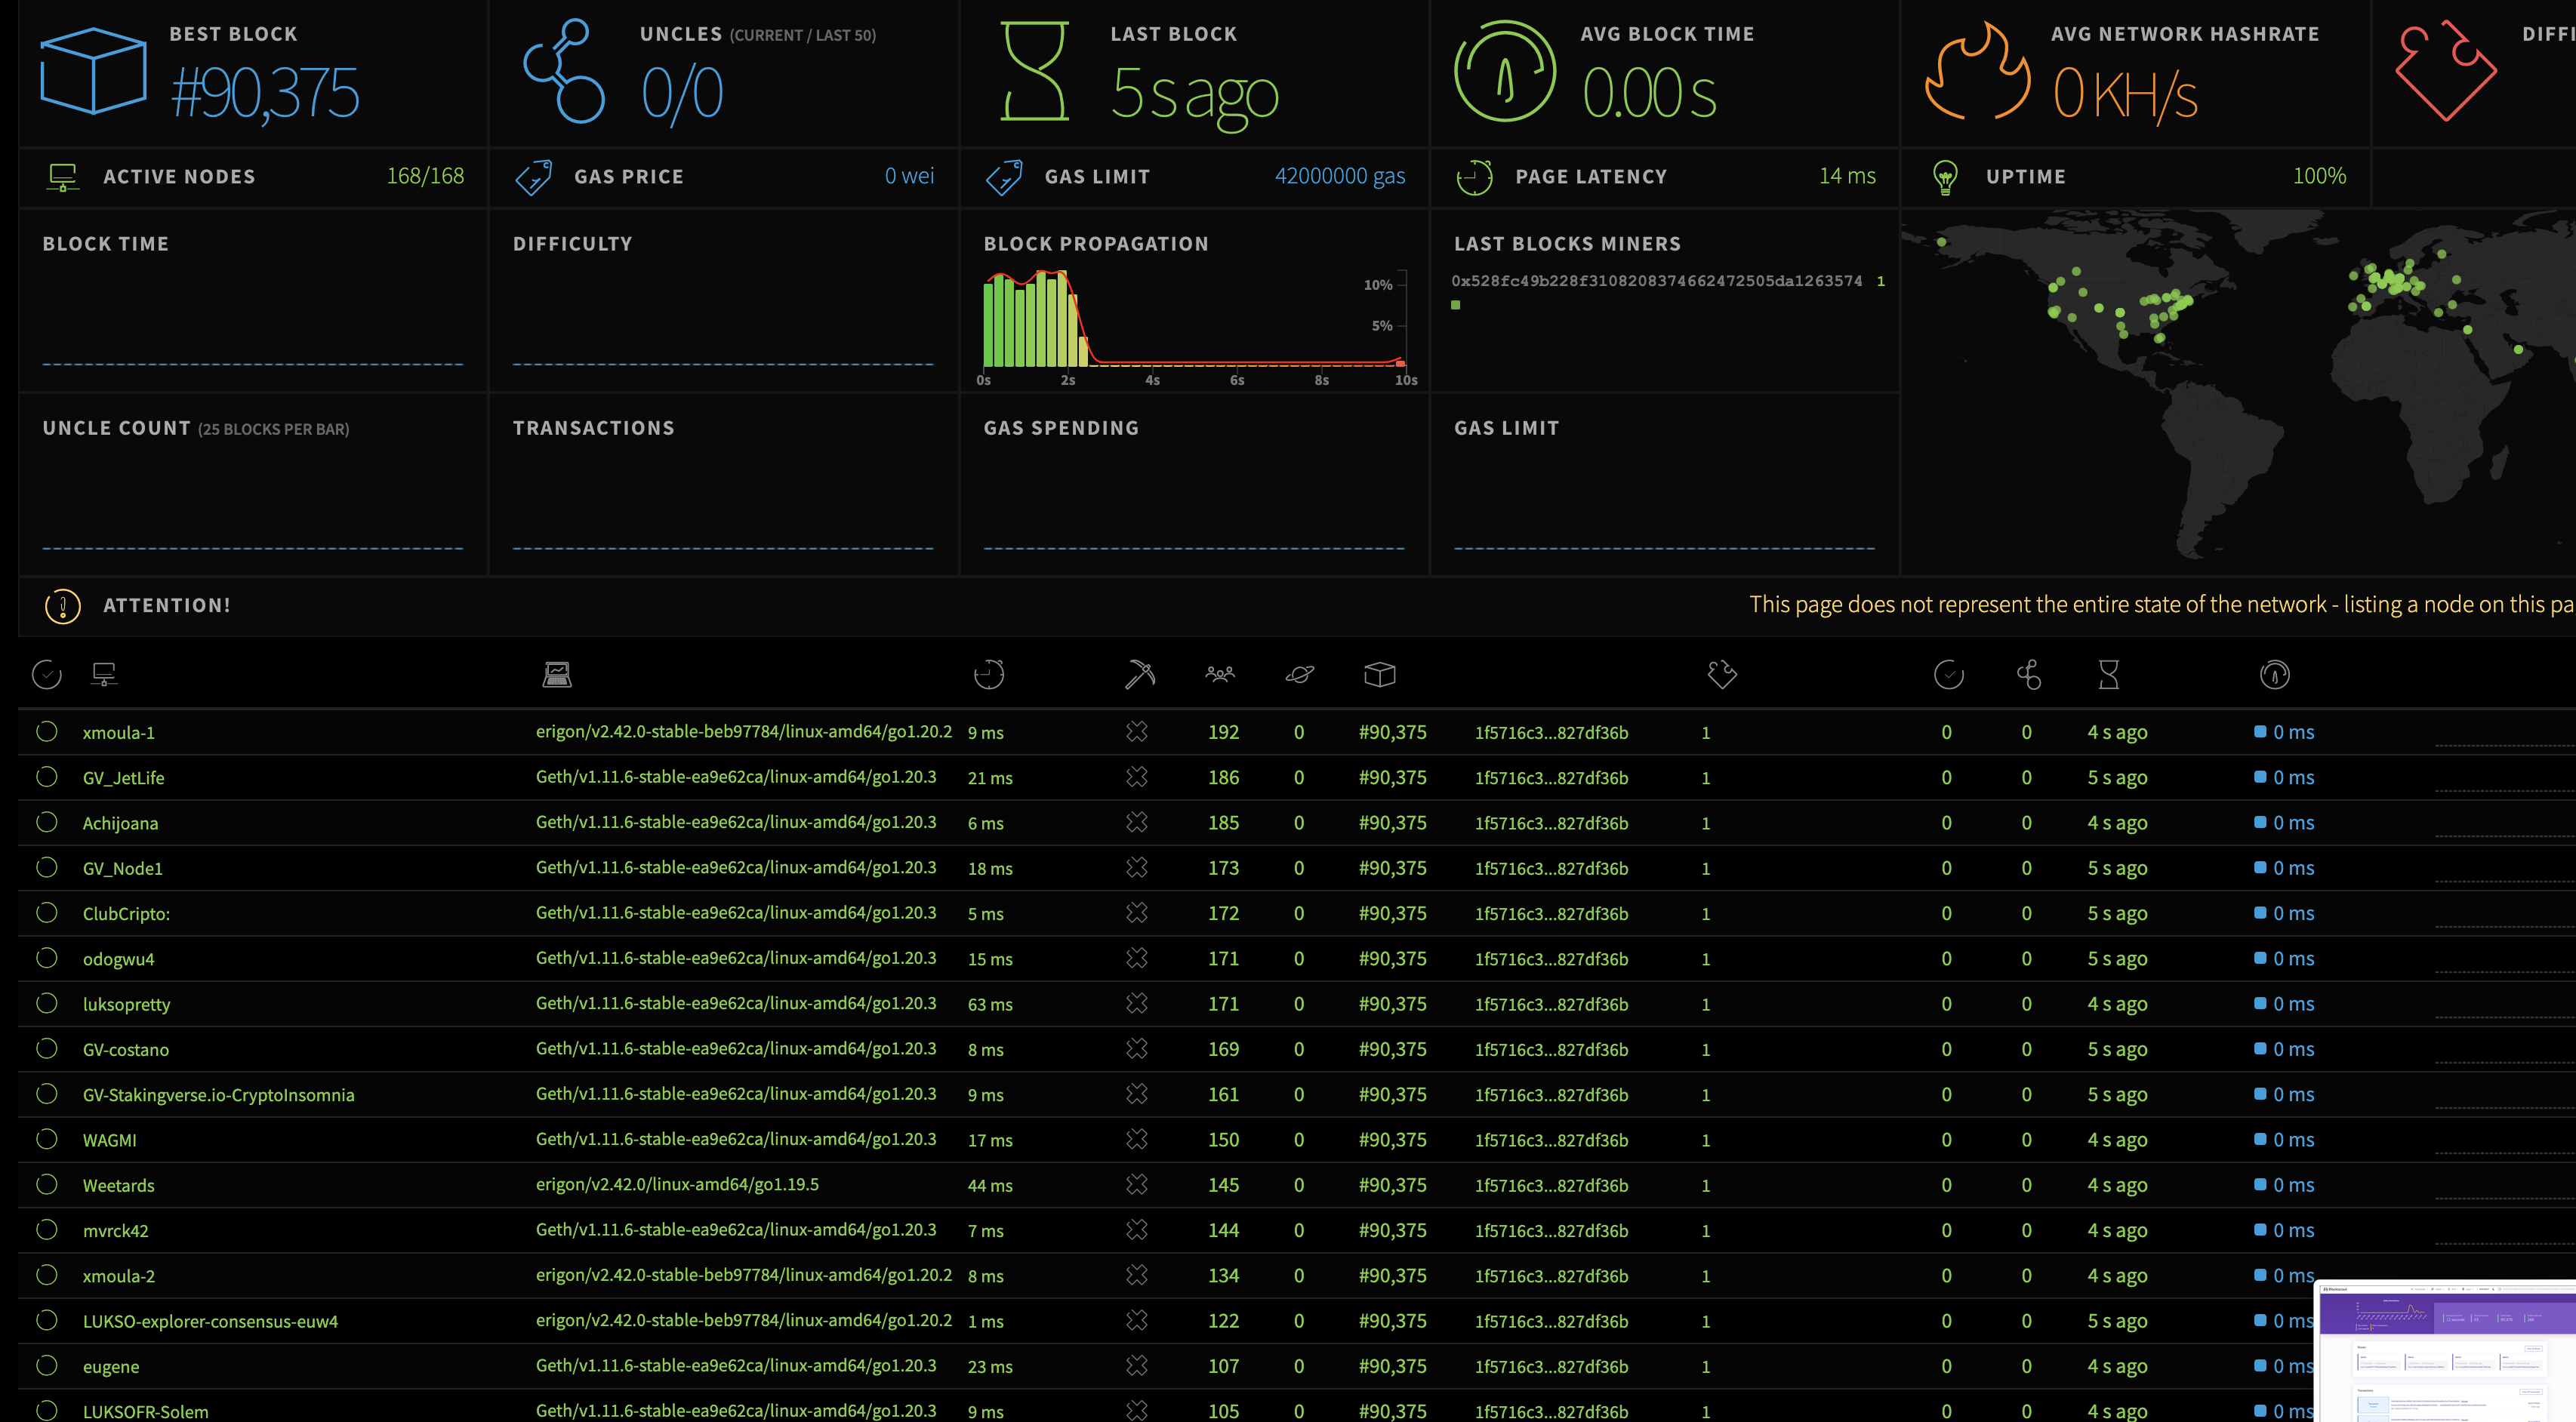
The Execution Status Page is crucial for tracking your node's overall health and performance. It displays your node if it has been added to the ETHStats page, showing the names of the nodes, their types, latencies, and the number of their peers. It also indicates pending transactions, the last synced block and its hash, and the timing of the last block. Furthermore, the total count of active nodes that activated the ETHStats client is readily available. The Execution Status Page is essentially a dashboard, providing all the critical metrics required to assess the performance of your node.
7.8.3 Consensus Block Explorer
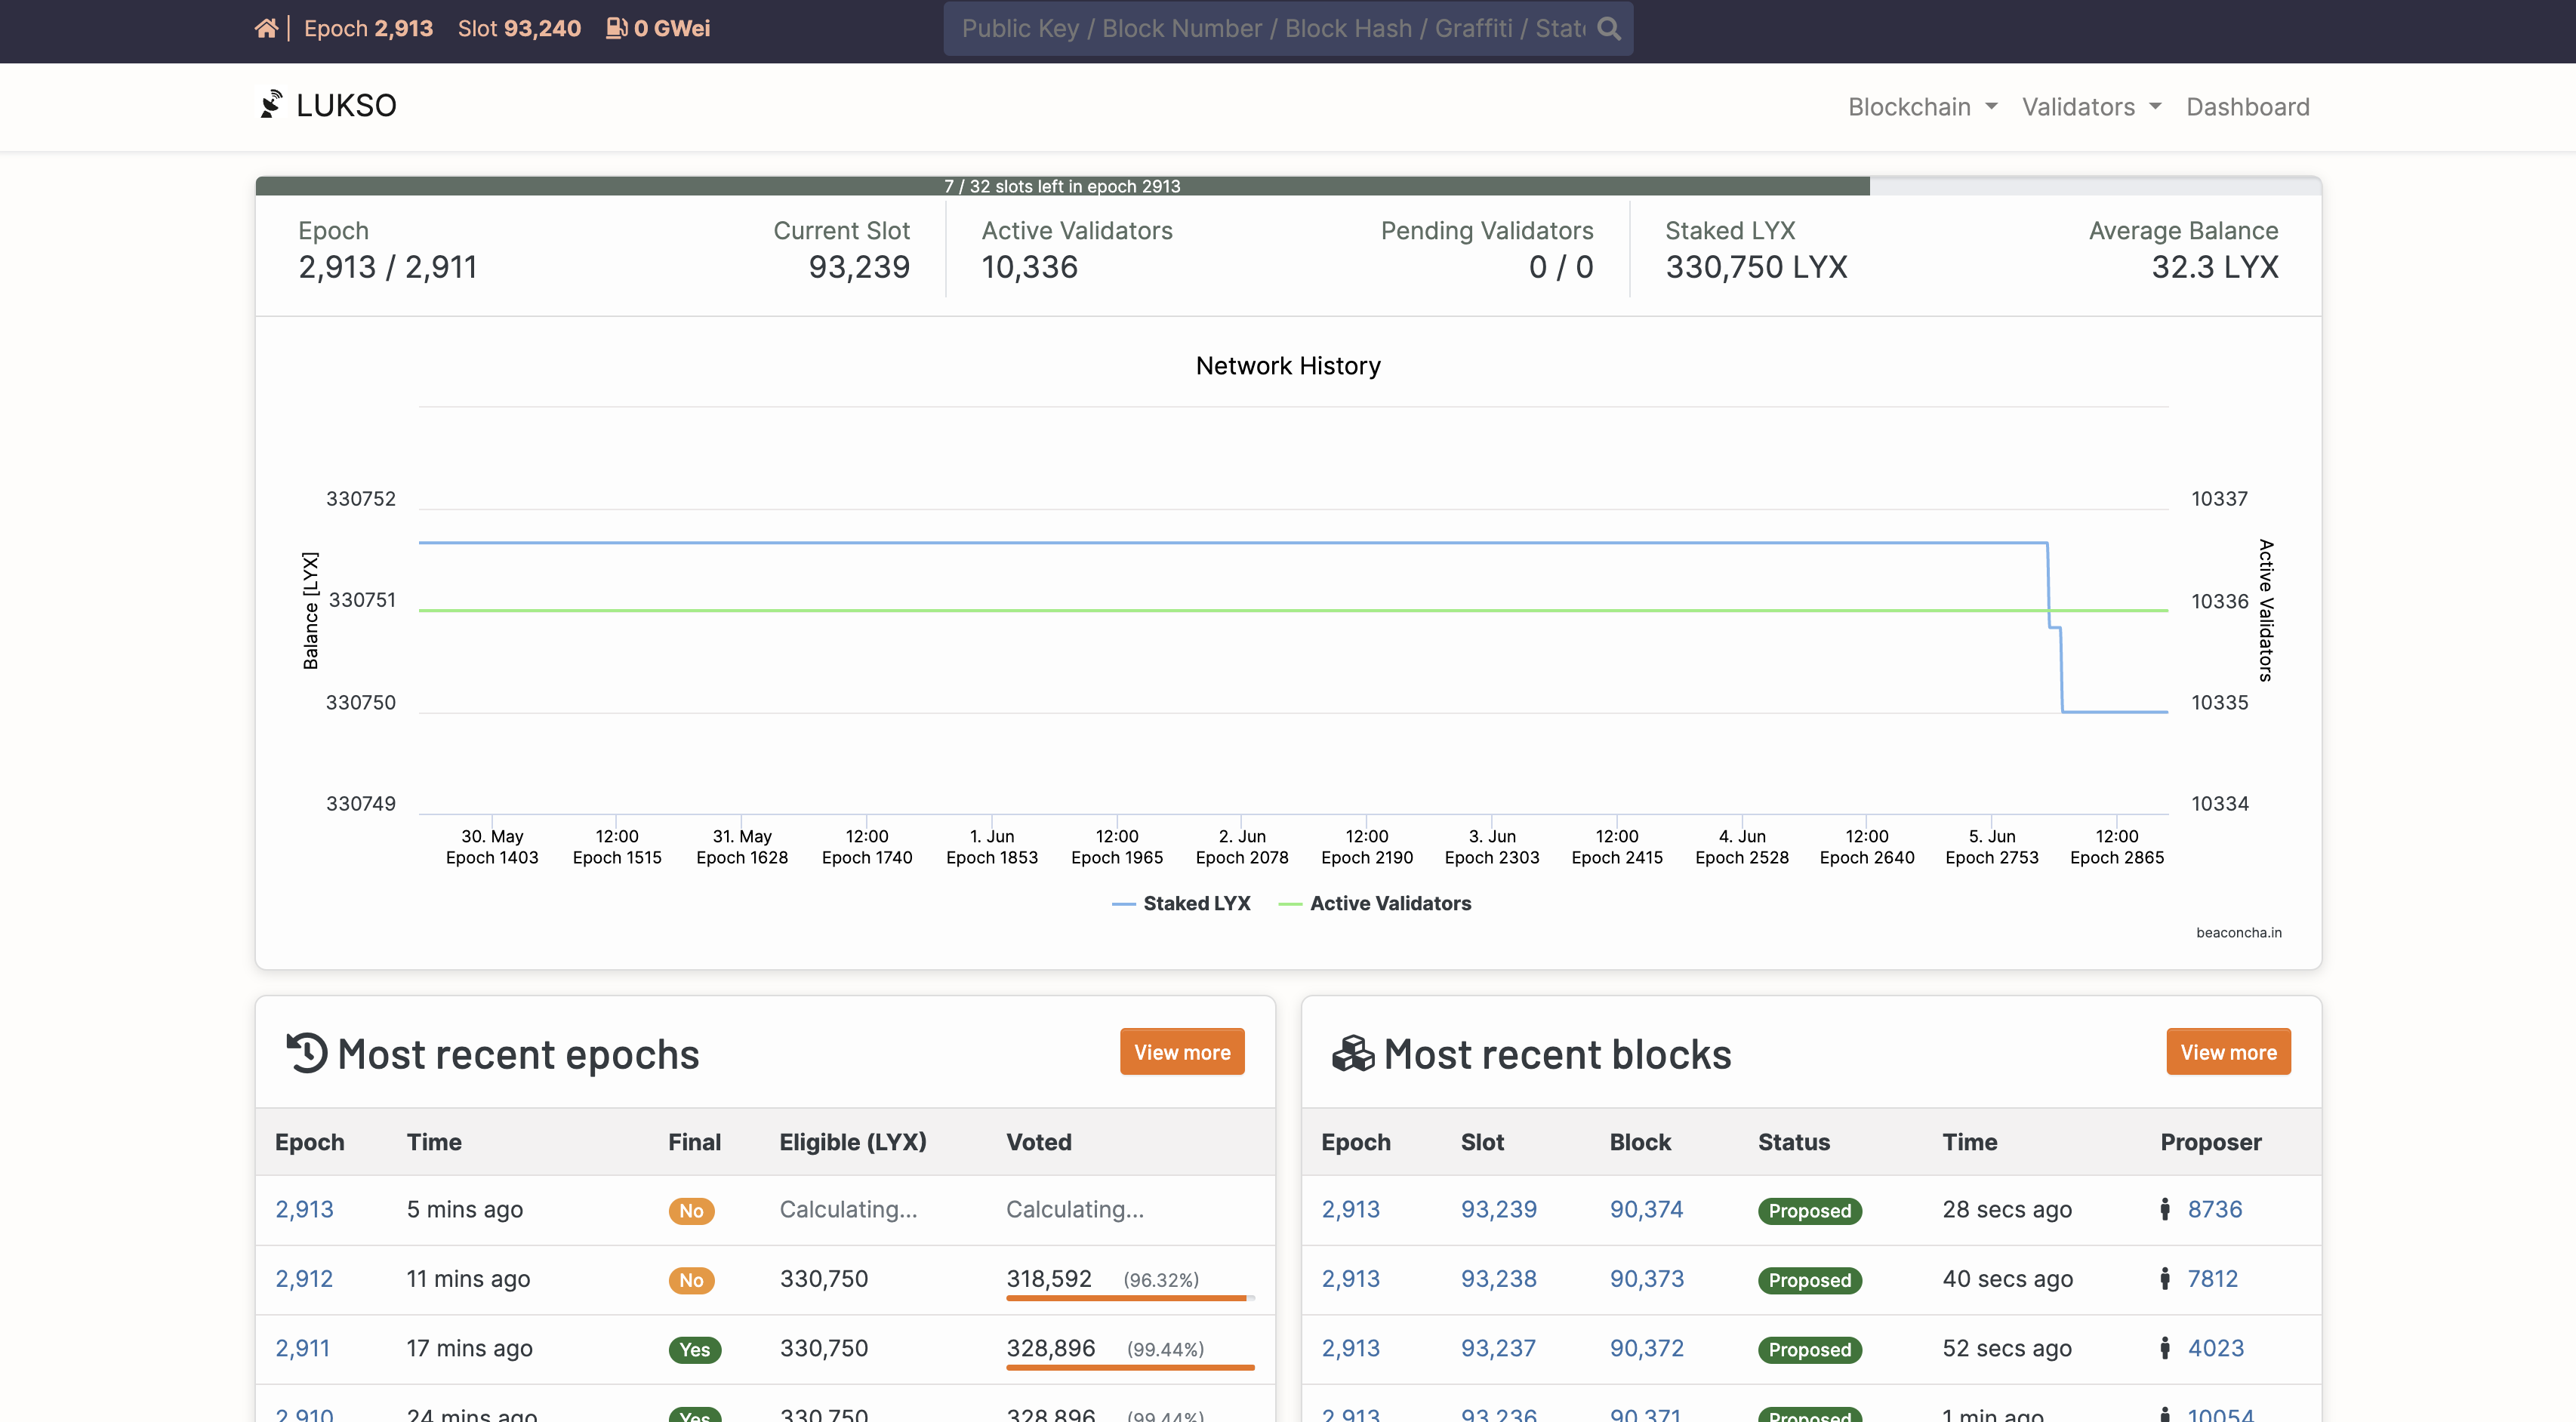
The Consensus Block Explorer offers comprehensive insights into the blockchain's current consensus status. It displays the present epoch, current slot, active and pending validator counts, the staked LYX, and the average balance. For each slot, the explorer provides information about the proposer, the sync participation, time, and status. The explorer also allows for an in-depth examination of each block, revealing the proposer's graffiti and all associated metadata. From the validator's perspective, it provides critical information about attestations and deposits, the validators' status and effectiveness, and their balance. This tool gives a clear view of the consensus health of the blockchain.
If you need more information about slots, epochs, and their status types, look into this guide's Network Theory section.
7.8.4 Consensus Status Page
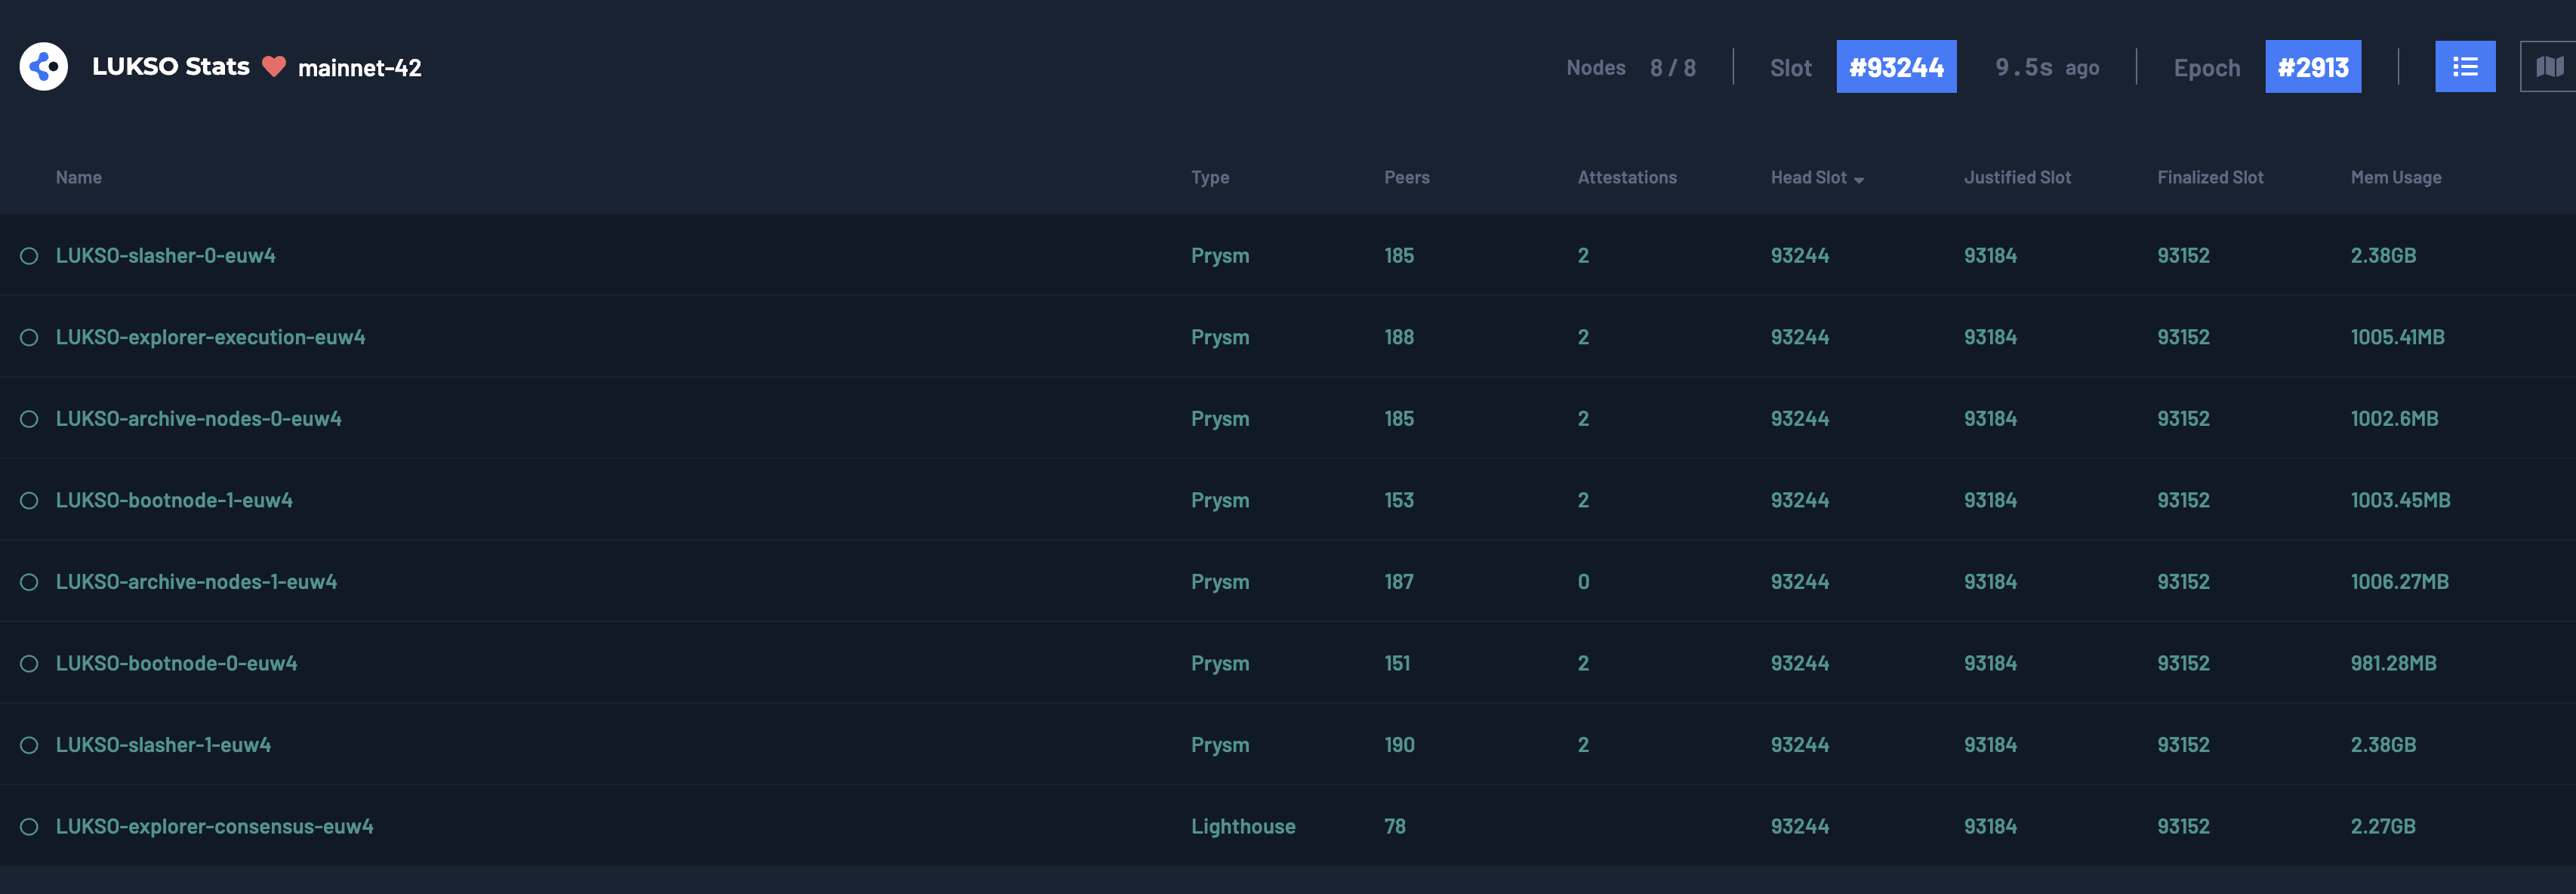
The Consensus Status Page is another tool for monitoring your node's operation. If your node has been added to the ETH2Stats page, it will show up here, along with details such as the node's name, consensus client type, consensus peers, attestations, head slot, justified slot, and finalized slot. It even displays the memory usage on the machine running the node. This information is crucial in monitoring the performance of your consensus mechanism and ensuring your blockchain system runs efficiently.
If you need more information about slots, epochs, and their status types, look into this guide's Network Theory section.
7.8.5 External Node Validator Checks
As the Consensus Explorer is the main page for every information going on with the consensus and single validators that propose and participate in the consensus, we can also set up a link for this page that gathers consensus information for every validator of our node at once.
First, log on to your node machine:
ssh <ssh-device-alias>
Then head over to your node's log directory. Exchange <node-working-directory> with the actual folder name and <network-type> with mainnet or testnet depending on your node's network.
cd <node-working-directory>/<network-type>-logs/
Next, we need to find the latest validator log file created for the node's network to get the total amount of imported validators. You can either check that manually or use the following script to automatically search for the validator logs, sort them by creation date and output the most recent filename to the terminal. I've used the find tool that is used to search for files and directories within a specified location and further used pipes as we already did plenty of times before. Here is a description of the script:
.: Represents the current directory.type f: Specifies that only regular files should be considered, excluding directories and other types of files.name "*validator*": Sets the pattern to match filenames containing "validator" anywhere within the name.printf "%T@ %p\n": Specifies the format for the output of the found files.%T@represents the file's last modification time in seconds since the epoch, and%prepresents the file path.sort -n: Sorts the output in ascending order based on the file's modification time.tail -1: Selects the last line from the sorted output, which corresponds to the file with the latest creation time.awk '{print $2}': Extracts the second column from the output, which contains the file path, and prints it.
find . -type f -name "*validator*" -printf "%T@ %p\n" | sort -n | tail -1 | awk '{print $2}'
Now we can search this log file to get all the index properties of each validator imported to the node. The script will fetch all indexes and build the link of the consensus page so that you can copy/paste it into the browser of your choice. Here is a description of the script:
cat file: The cat command is used to concatenate and display the contents of a file, in our case the latest validator log.grep -o 'index=[0-9]* ': Searches for the patternindex=followed by a sequence of digits, and outputs only the matching parts. The-oflag tells grep to output only the matching index numbers, not the entire line.awk -F'=' '{printf "%s,", $2}': Uses the equals sign=as the field separator-Ffor the output of thegrepcommand. It then only prints the numbers after the equals sign, which corresponds to the validator index, separated by a comma.sed 's/,$//': Removes the trailing comma from the output.tr -d ' ': Deletes any remaining spaces from the index list.awk '{print URL $0}': Prepends the extracted validator index numbers to the URL, creating a complete link for all validator index numbers, represented by$0.
Make sure to exchange <recent-validator-logs.log> with the actual filename from the previous step.
Testnet Validator Script
cat <recent-validator-logs.log> | grep -o 'index=[0-9]* ' | awk -F'=' '{printf "%s,", $2}' | sed 's/,$//' | tr -d ' ' | awk '{print "https://explorer.consensus.testnet.lukso.network/dashboard?validators=" $0}'
Mainnet Validator Script
cat <recent-validator-logs.log> | grep -o 'index=[0-9]* ' | awk -F'=' '{printf "%s,", $2}' | sed 's/,$//' | tr -d ' ' | awk '{print "https://explorer.consensus.mainnet.lukso.network/dashboard?validators=" $0}'
The output will look similar to this one, having all your index numbers:
https://explorer.consensus.mainnet.lukso.network/dashboard?validators=1,2,3
The link can then be copied from the terminal and saved as a bookmark in your browser.
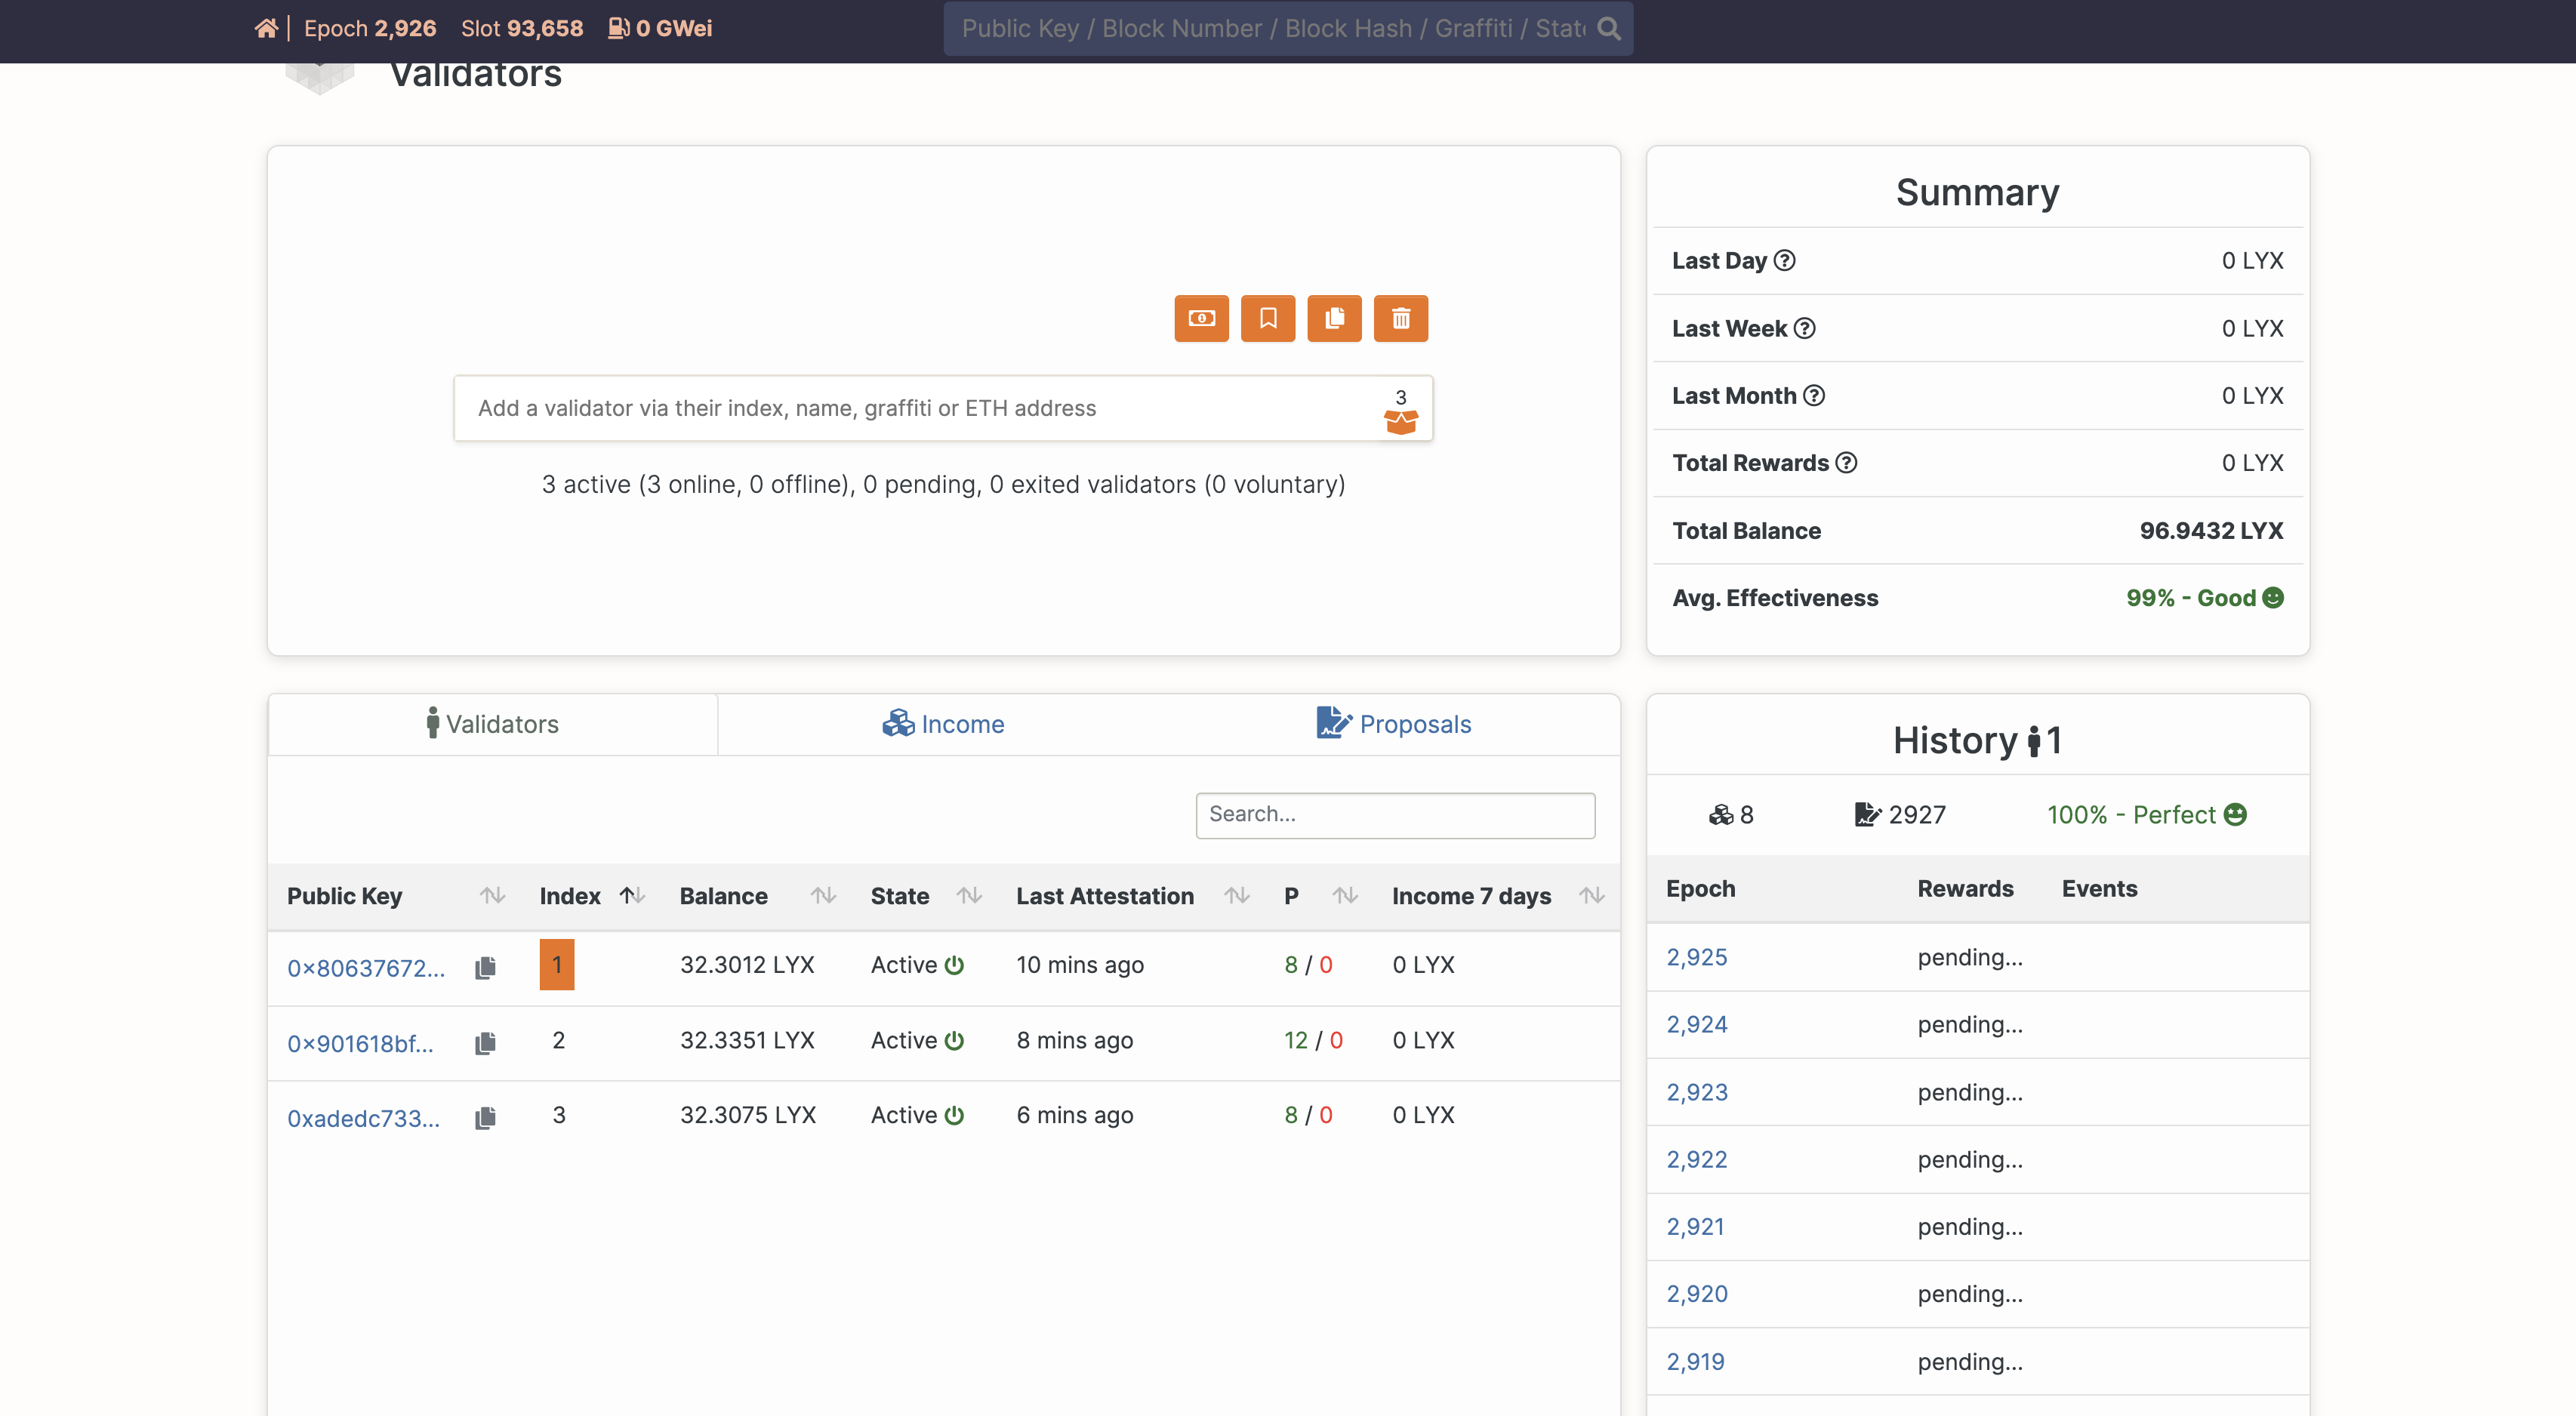
The page will look like the one below. It shows the status and uptime of your validators that are run on your node:
