Enable Alerts
Grafana can send alerts through various channels, such as Discord, Telegram, or Email when unregular behavior in metrics or reading from Prometheus is recognized. The following will guide will configure Grafana notifications for Telegram.
It is convenient to temporarily open a text editor to store information needed for these steps.
8.1.1 Create Telegram Bot
You need a Telegram account in order to continue.
- Open the web-based or Desktop version of Telegram.
- Click on this link https://t.me/botfather and allow the BotFather application to open Telegram.
- A BotFather channel will open.
- Type
/newbotin the message line - Send off the message
- Choose a full name for your bot.
- Choose a user name for your bot. The name must end with
bot - A message will appear with information about your bot.
- Highlight and copy the API token, then paste it into your text editor.
8.1.2 Create a Group
- Open the Telegram menu.
- Set up a new group.
- Choose a name for the group.
- Add your bot to the group by typing the exact username
- Select the user when it appears in the list and click
create - Send a message
/my_idto trigger the API refresh - Copy
https://api.telegram.org/bot<your-bot-api-token>/getUpdatesto a text document. - Replace
<your-bot-api-token>with your token ID of the bot
8.1.3 Fetching the Chat ID
- Copy the link you just edited into a web browser.
- Look for text that says
{"id"}: - Copy and paste the
idinto your notes.
Ensure your Chat ID is fully copied. It might have a
-in front.
8.1.4 Add Telegram Contact Points
Return to Grafana
Login using your credentials
On the left-hand menu, click
AlertingClick the
Contact Pointson the left sideClick
Add contact pointClick on
Add channelFill in the following information:
Name: Your Notification Channel NameIntegration:TelegramBOT API Token:Your copied BOT API TokenChat ID:The copied Chat ID
Click
Testwithin the Integration Panel.Wait until you see a new message in Telegram.
Click
Save contact point.
8.1.5 Update Notification Policies
- On the left-hand menu, click
Alerting - Click the
Notification policieson the left side - On the right of the default notification, click the 3-dot-menu and chose
Edit - Change
Default contact pointto Telegram's Contact Point - Click
Update default policy
8.1.6 Add Notifications to Metrics
In order to make sure that the node notifies you if some process is down, follow these steps. If something is unclear, you can have a look at the picture of each alert down below.
Make sure to get the latest dashboard of this guide, before continuing.
- Click the Granfana Icon to get to the landing page.
- Click the LUKSO Dashboard.
- Scroll down to the dashboard's
Alertssection. - Select each alert and click
Editon the 3-dot-menu. - Within the
Alerttab, selectCreate alert rule from this panelif you do not already see a alert panel on the page that you can click on. Do not worry if you need to create it first, as this is the default behavior since you will have to create folders and groups first. - Click
Previewto print out the graph to evaluate metric numbers. - Adjust the
Thresholdsection to your likings on when the alert should happen. - In case the
Reducesection is showing multiple lines and one of them isNaN, setReplace Non-numeric Valueswith a custom number above the alert range. For single line metrics that rely on clients or the network, its recommended to set aNaNnumber within the alert range, meaning that an alert is sent when the process or network is currently down. - Within the
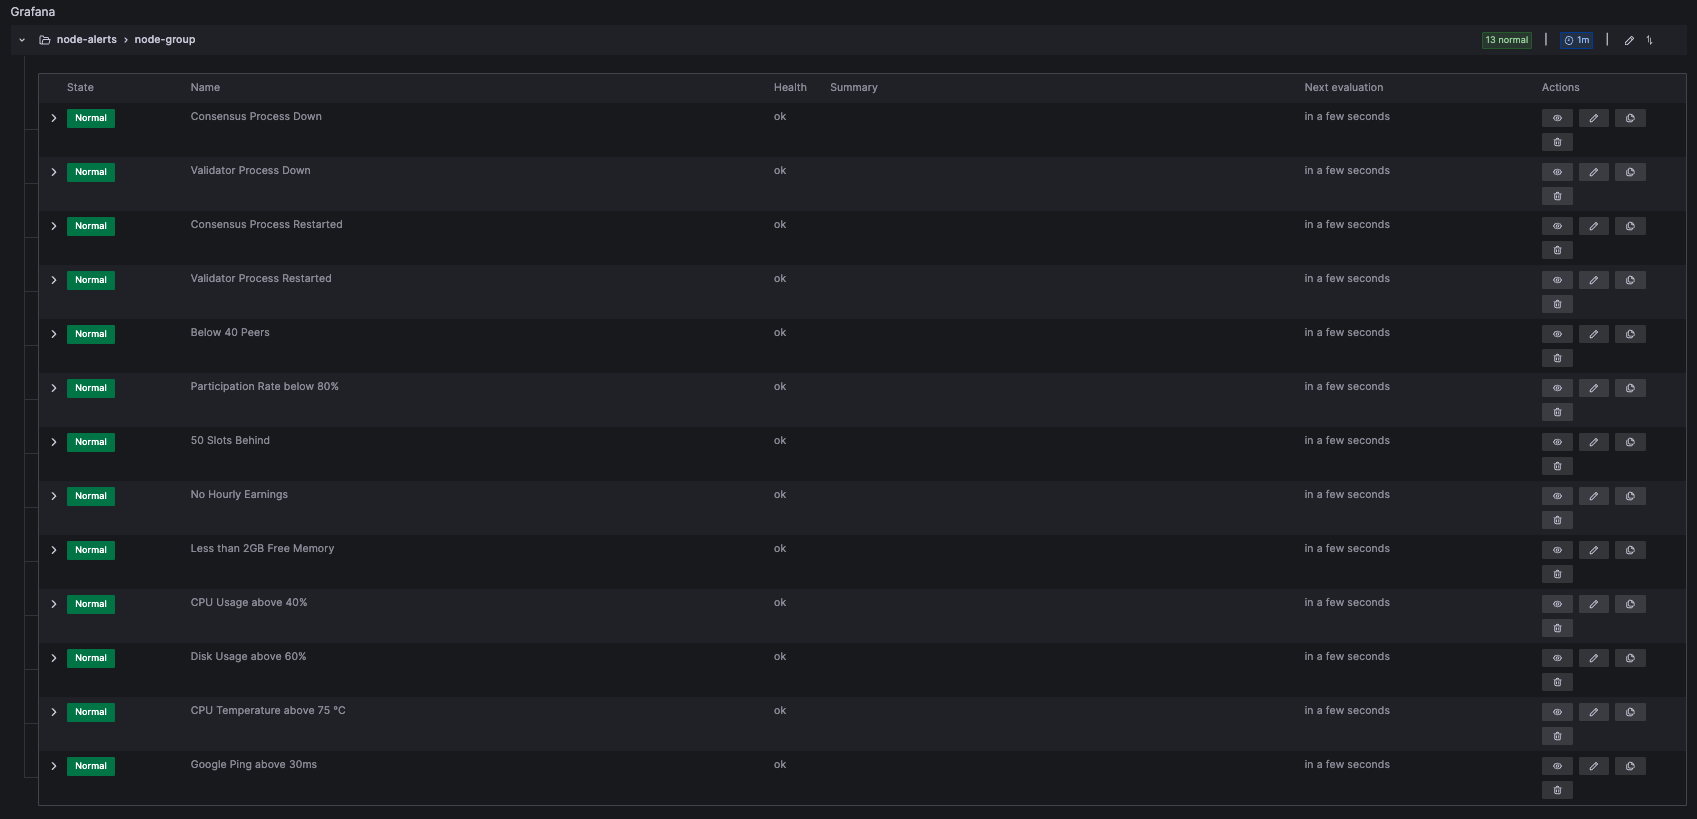
Alert evaluation behaviorsection, add anode-alertsfolder where all the alert data will be stored. If it is already existing, select it from the panel. You can change the name of the folder of your likings, it is just to group alert's data. Its recommended to always choose the same name for one network, node or validator, so you do not mix up various targets and dashboards. - Within the
Evaluation groupselection, add anode-group. If it is already existing, select it from the panel. You can change the name of the group of your likings, it is just to group alert's data. Its recommended to always choose the same name for one network, node or validator, so you do not mix up various targets and dashboards. - Scroll up and click
Save - Repeat this for every Alert on the Dashboard.
8.1.7 Metrics Presets
Here are some example metrics that are included in the default dashboard. You can check the picures and validate if everything is configured the same way as in the guide.
Consensus Process Down
1: Process up
0: Process down
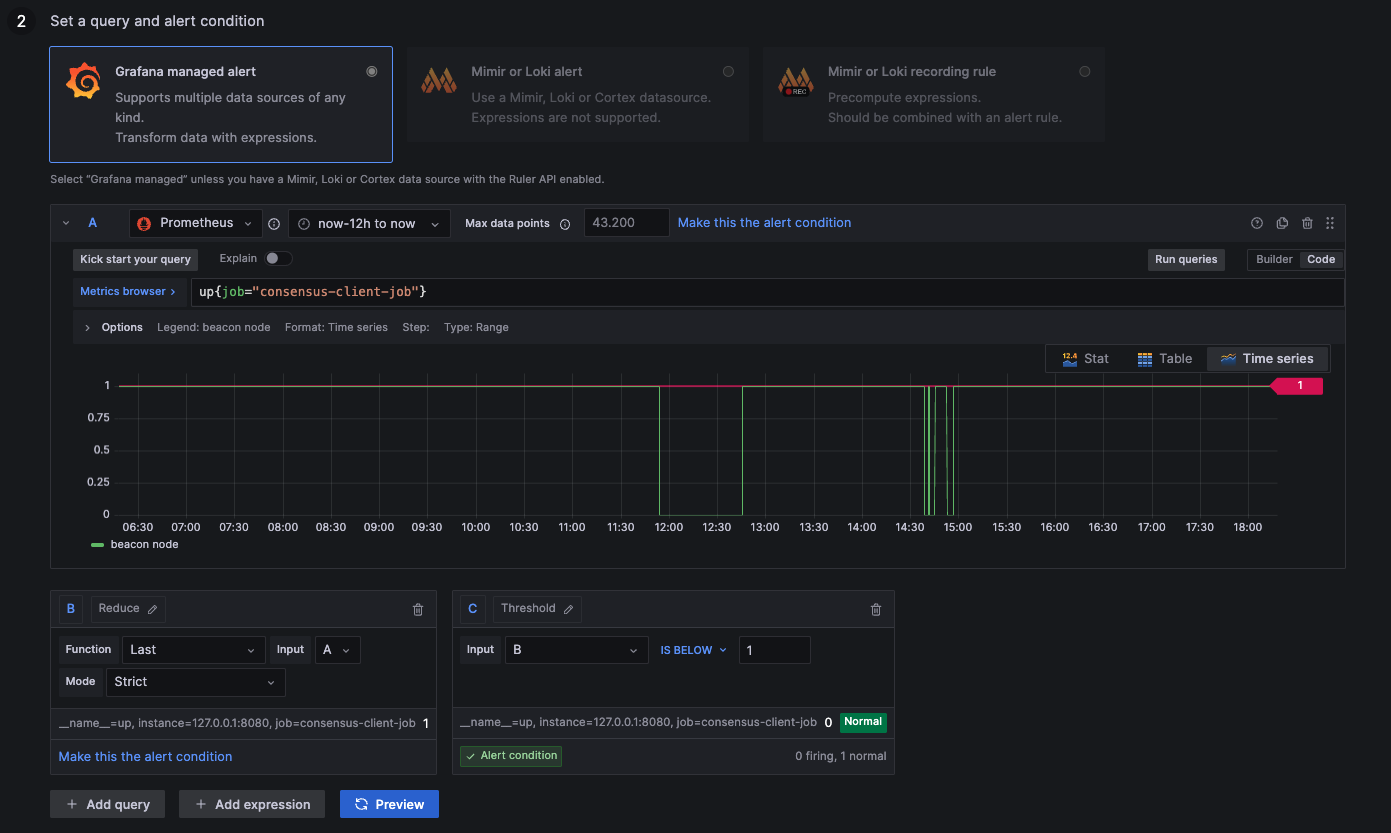
up{job="consensus-client-job"}
Validator Process Down
1: Process up
0: Process down
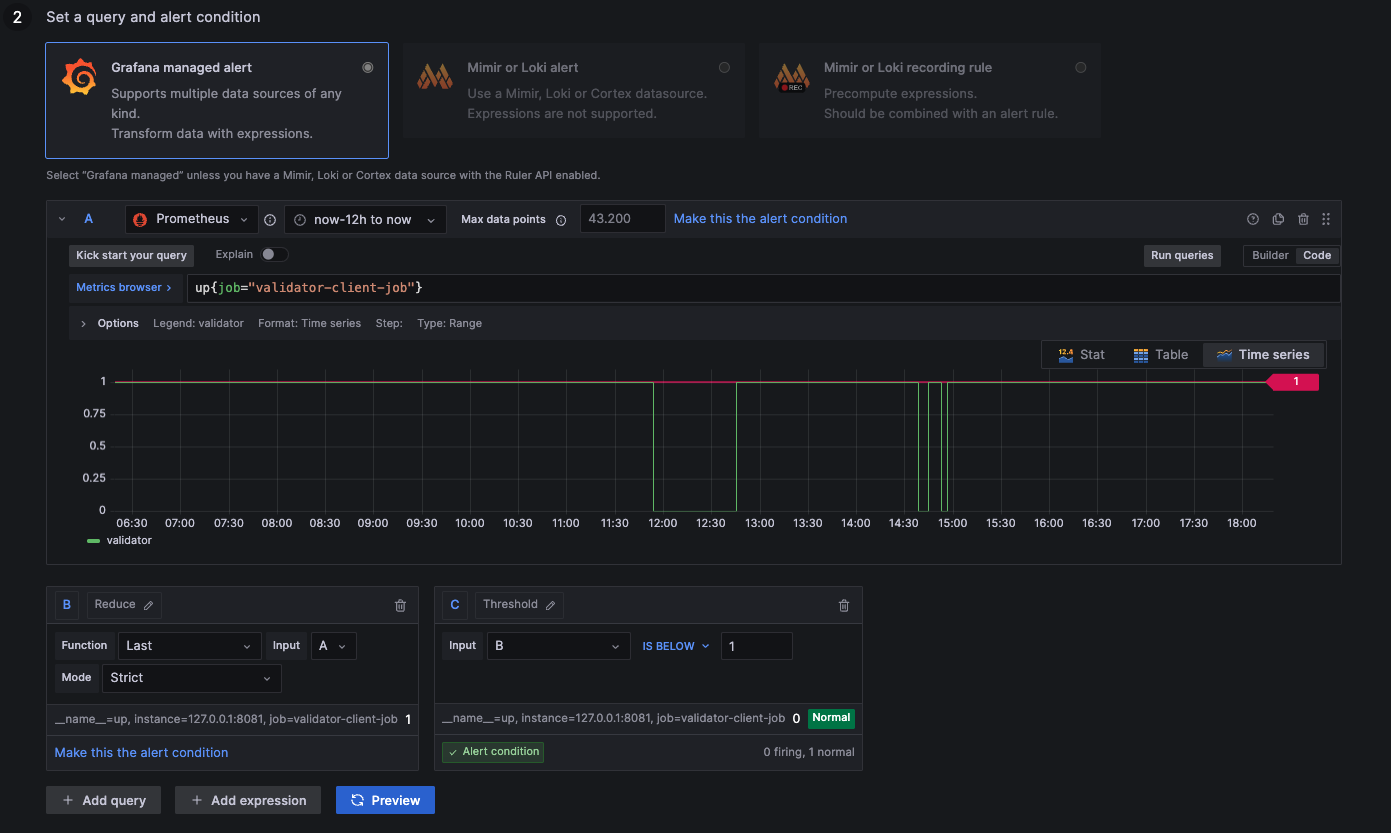
up{job="validator-client-job"}
Consensus Process Restarted
1:   Process up
0:   Process down
NaN: Not available (likely down --> 0)
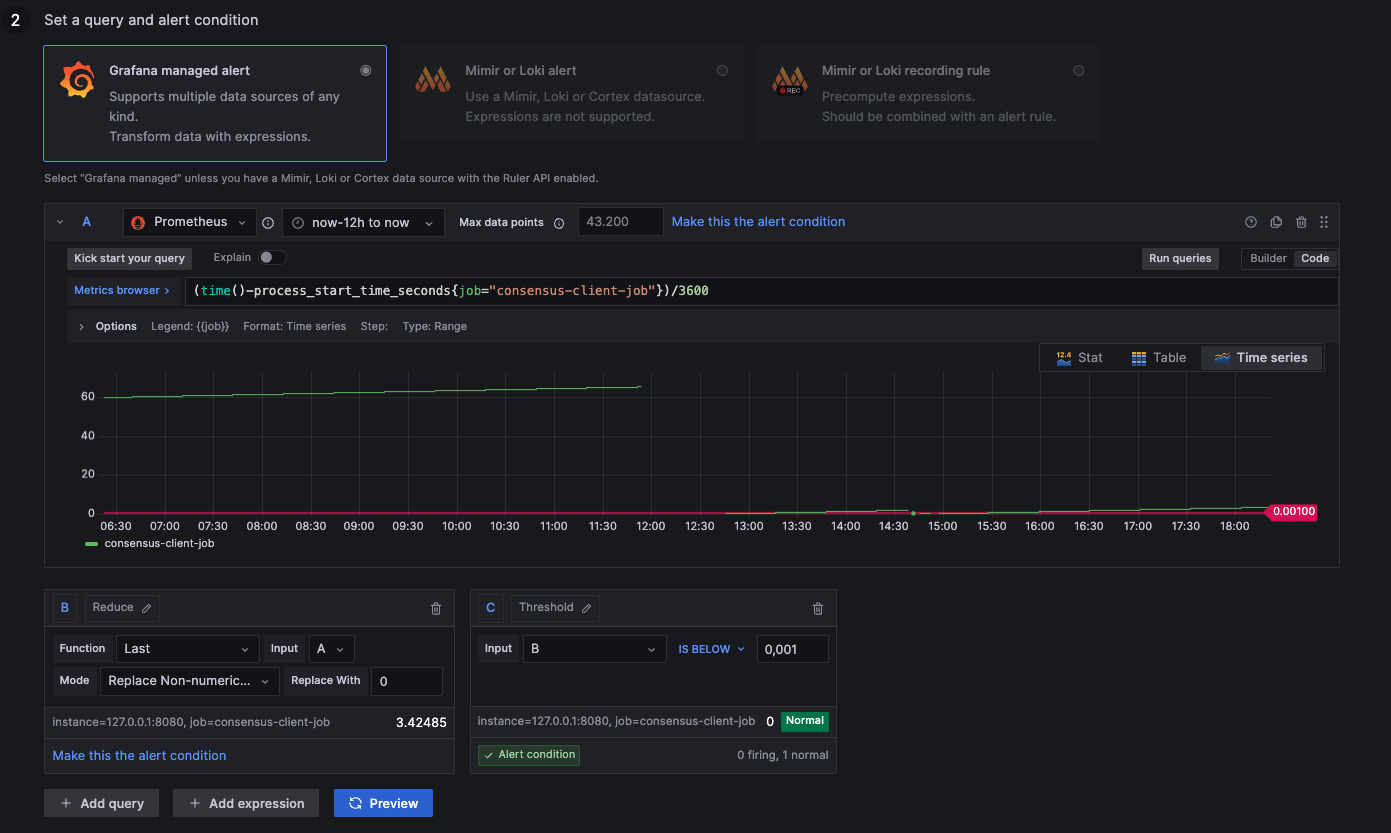
(time()-process_start_time_seconds{job="consensus-client-job"})/3600
Validator Process Restarted
1:   Process up
0:   Process down
NaN: Not available (likely down --> 0)
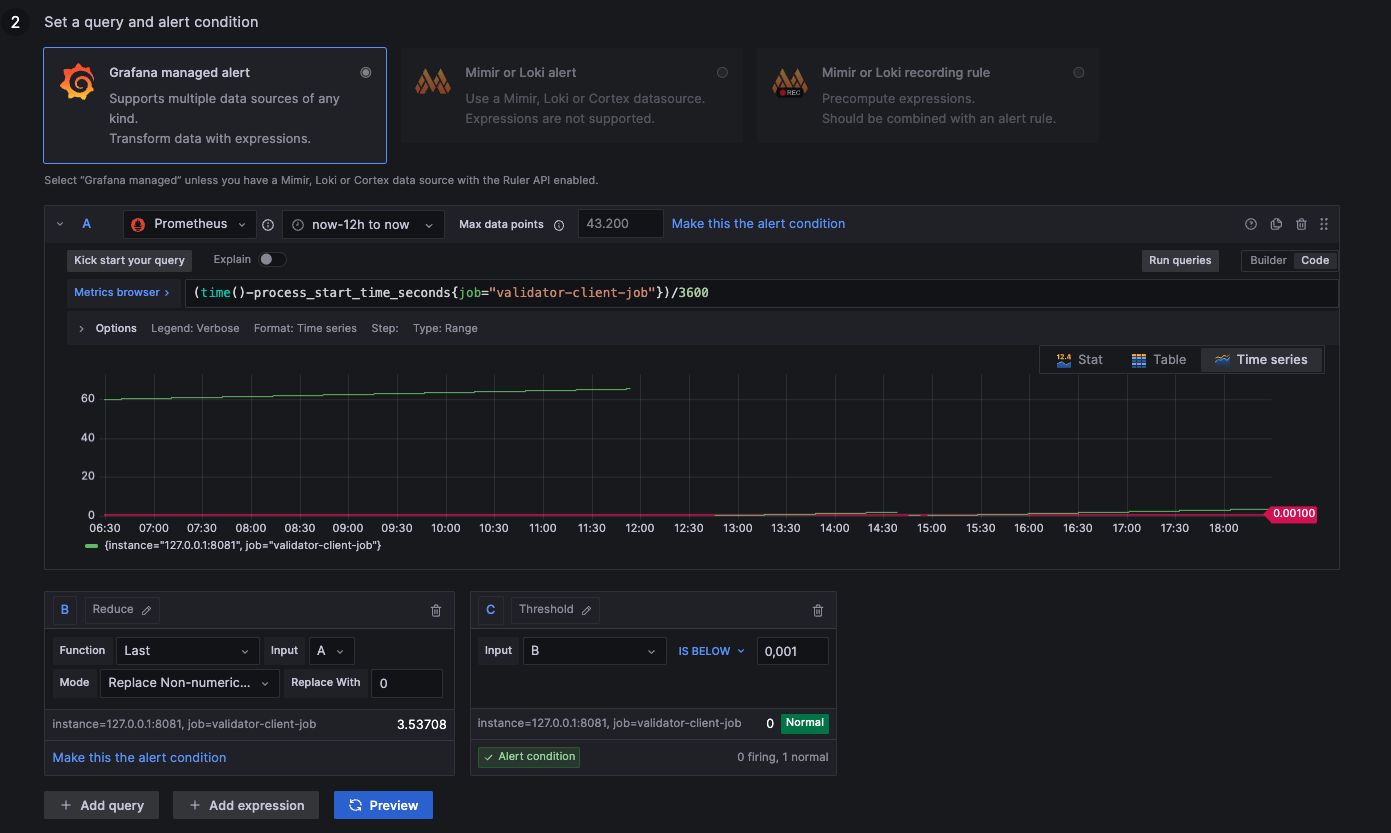
(time()-process_start_time_seconds{job="validator-client-job"})/3600
Below 40 Peers
above 30: Ideal healthy connections
below 30: Resyncing or weak connections
NaN:      Not available (no connections --> 0)
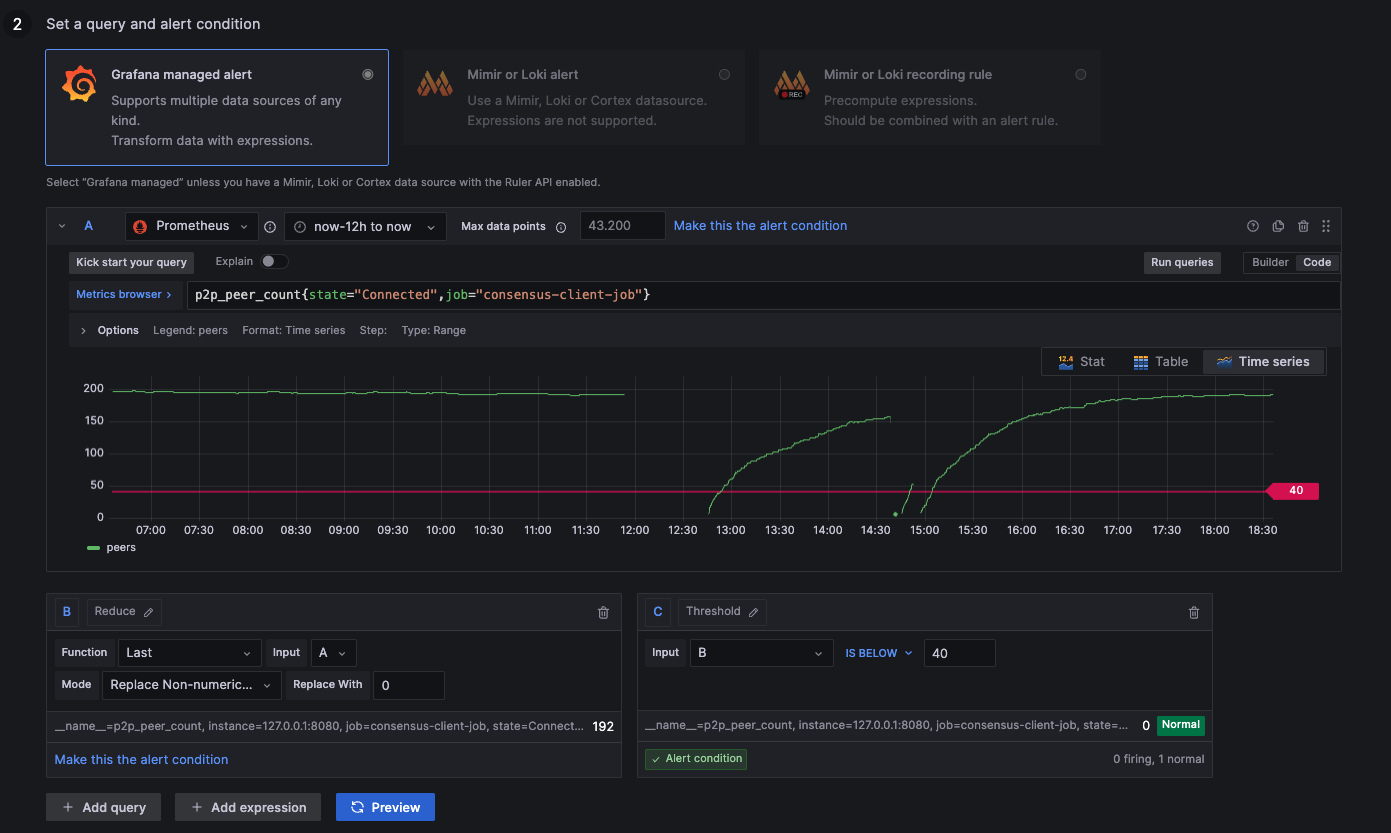
p2p_peer_count{state="Connected",job="consensus-client-job"}
Participation Rate below 80%
above 80: Ideal healthy network
below 80: Unstable network
NaN:      2nd data feed (ignore metric --> 100)
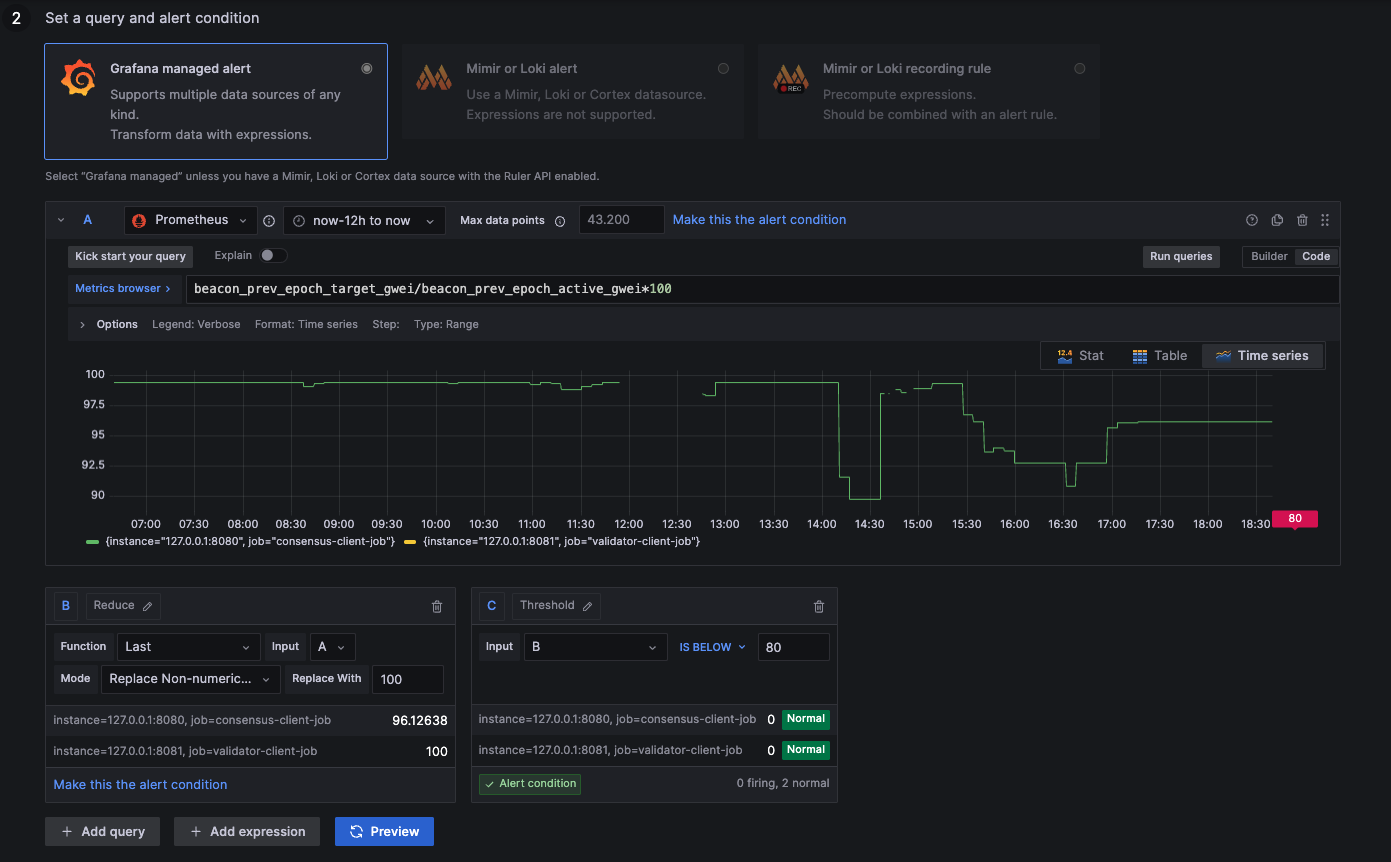
beacon_prev_epoch_target_gwei / beacon_prev_epoch_active_gwei * 100
50 Slots Behind
below 50: Ideal syncing speed
above 50: Unstable syncing
NaN:      Not available (likely unstable --> 51)
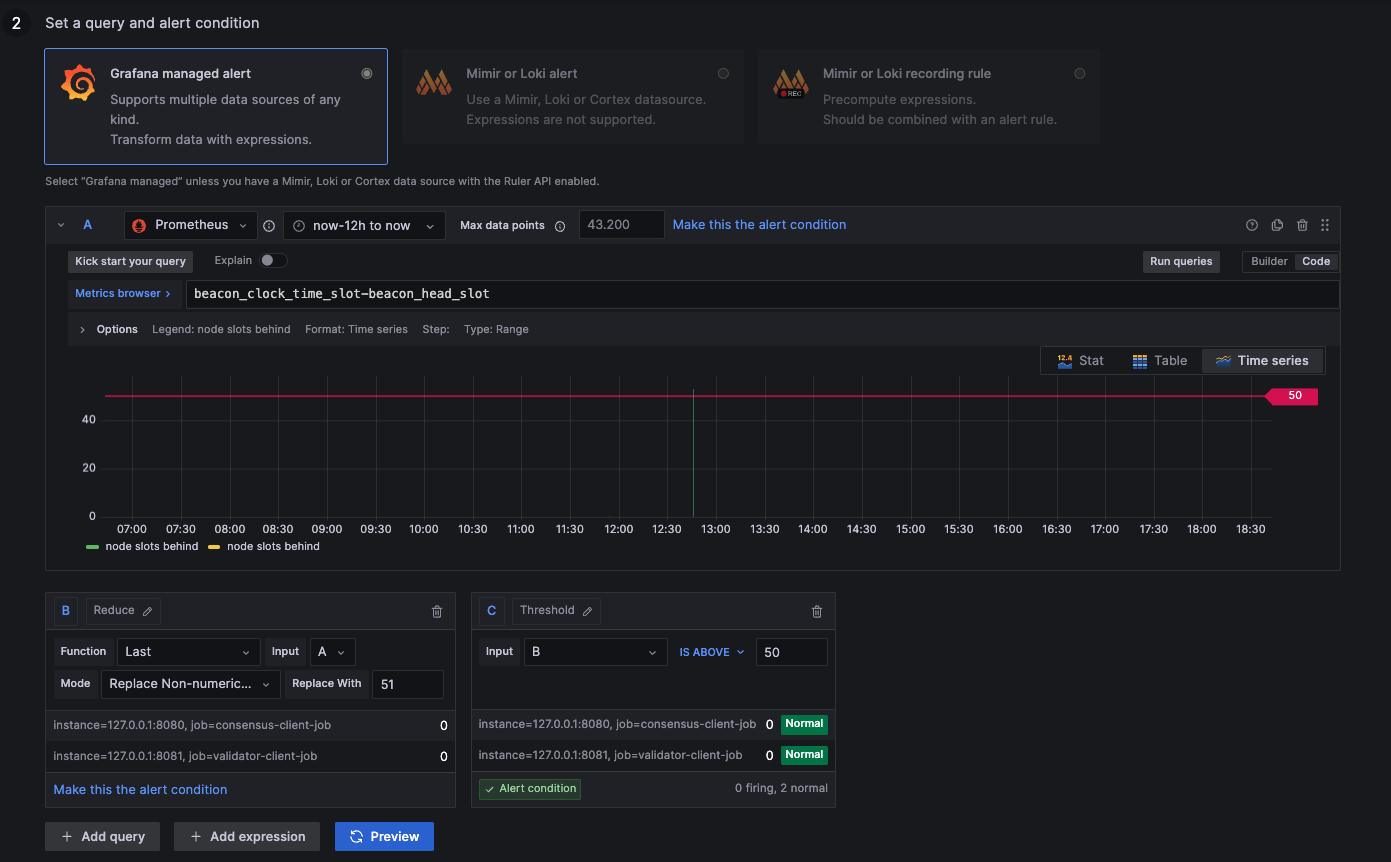
beacon_clock_time_slot-beacon_head_slot
No Hourly Earnings
above 0,0001: Earning rewards
below 0,0001: Syncing or negative rewards
NaN:          Not available (likely negative rewards --> 0)
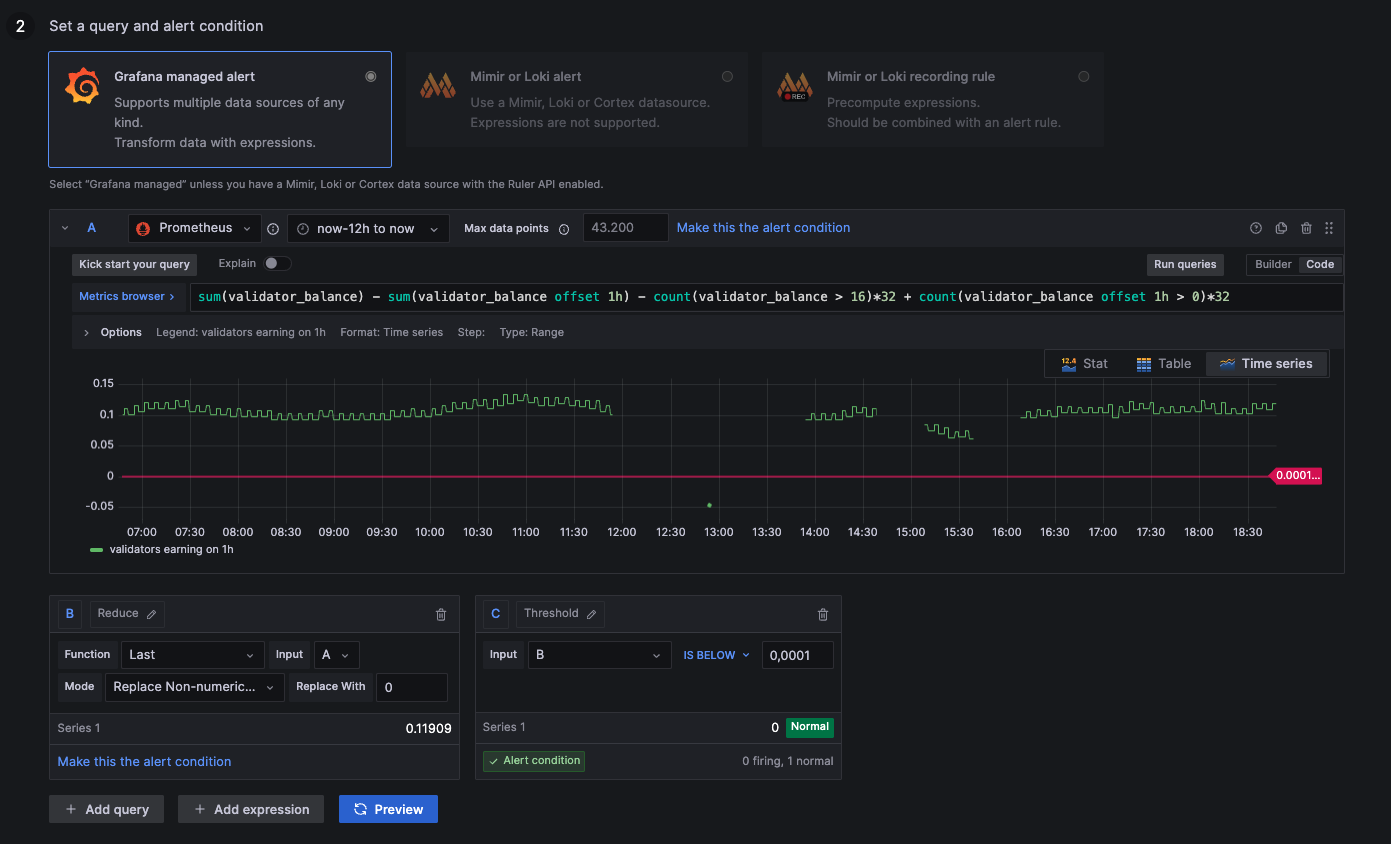
sum(validator_balance) - sum(validator_balance offset 1h) - count(validator_balance > 16)*32 + count(validator_balance offset 1h > 0)*32
Less than 2GB Free Memory
above 2000000000: More than 2GB remaining
below 2000000000: Less than 2GB remaining
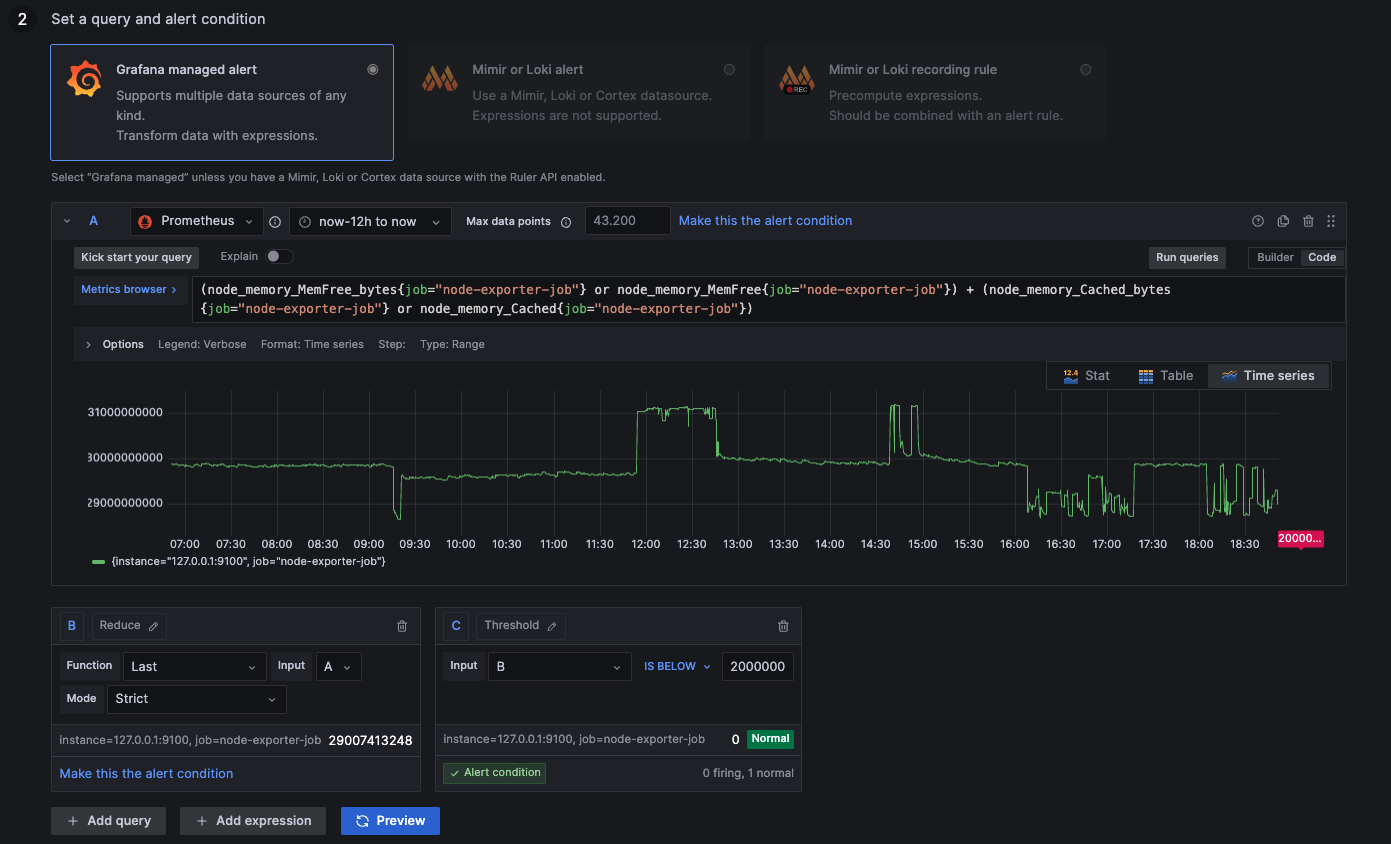
(node_memory_MemFree_bytes{job="node-exporter-job"} or node_memory_MemFree{job="node-exporter-job"}) + (node_memory_Cached_bytes{job="node-exporter-job"} or node_memory_Cached{job="node-exporter-job"})
CPU Usage above 40%
above 4: More than 40% of computation resources used
below 4: Less than 40% of computation resources used
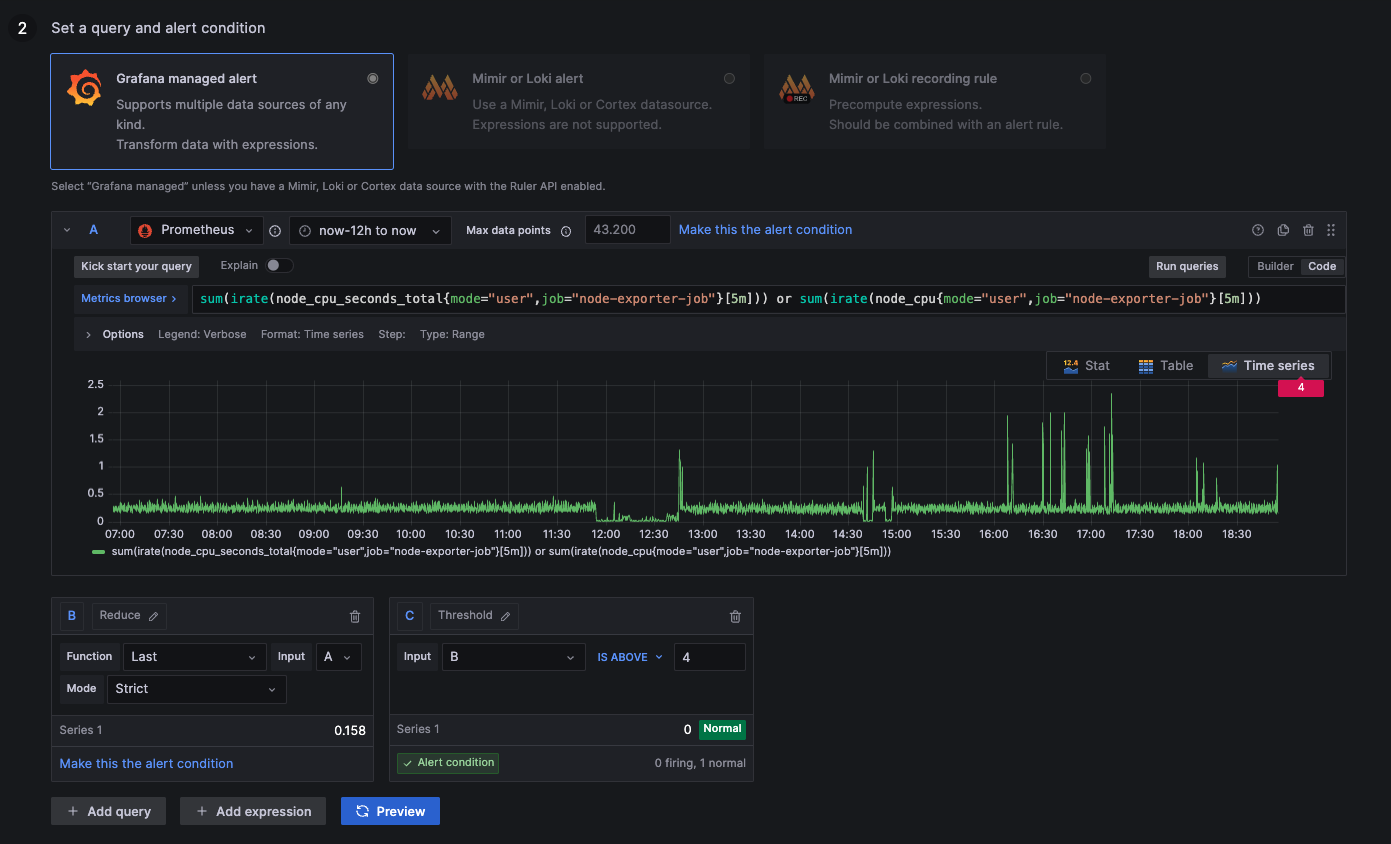
sum(irate(node_cpu_seconds_total{mode="user",job="node-exporter-job"}[5m])) or sum(irate(node_cpu{mode="user",job="node-exporter-job"}[5m]))
Disk Usage above 60%
above 0,6: Disk more than 60% occupied by tasks
below 0,6: Disk less than 60% occupied by tasks
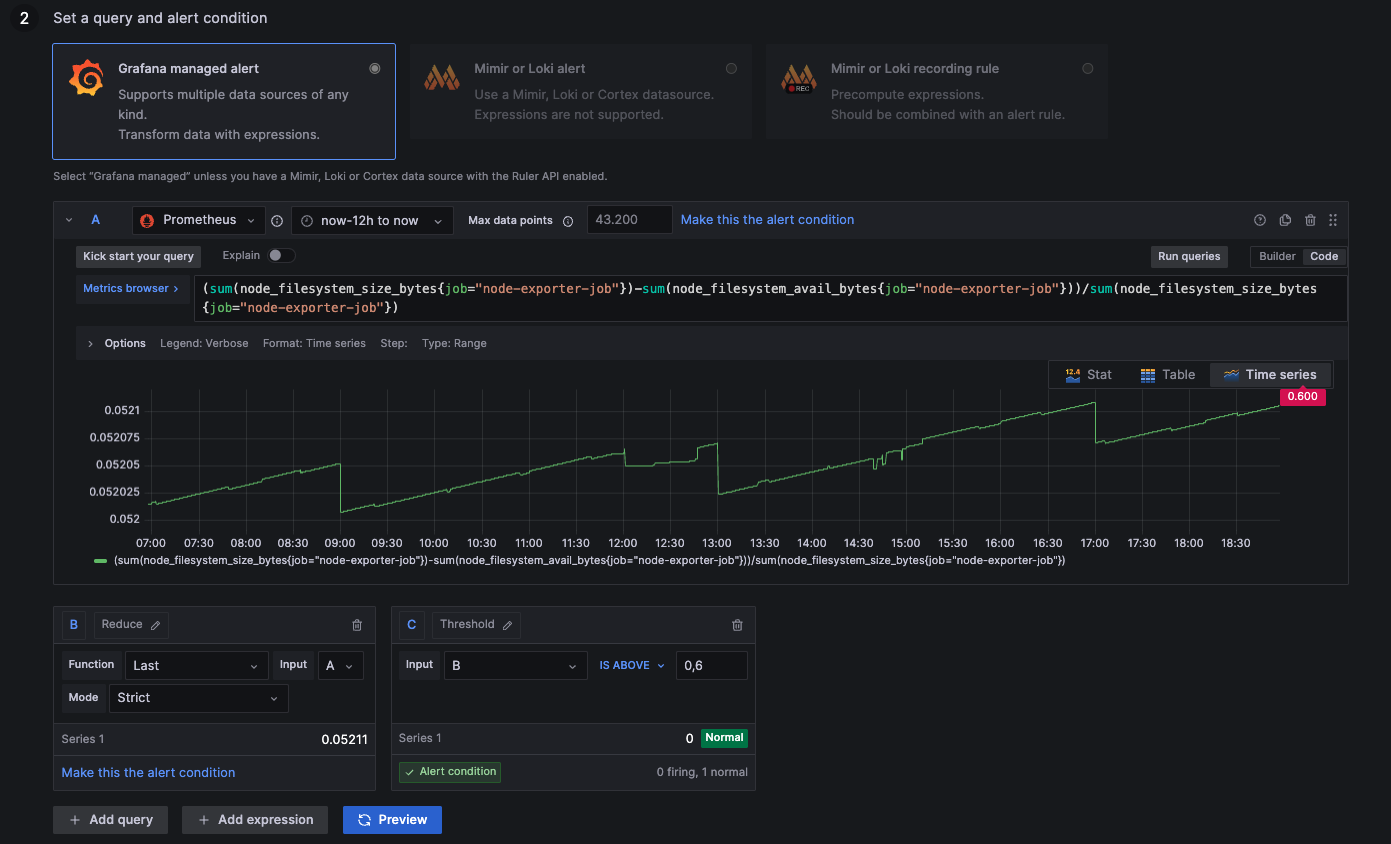
(sum(node_filesystem_size_bytes{job="node-exporter-job"})-sum(node_filesystem_avail_bytes{job="node-exporter-job"}))/sum(node_filesystem_size_bytes{job="node-exporter-job"})
CPU Temperature above 75 °C
above 75: Processor is running hot
below 75: Processor is running normally
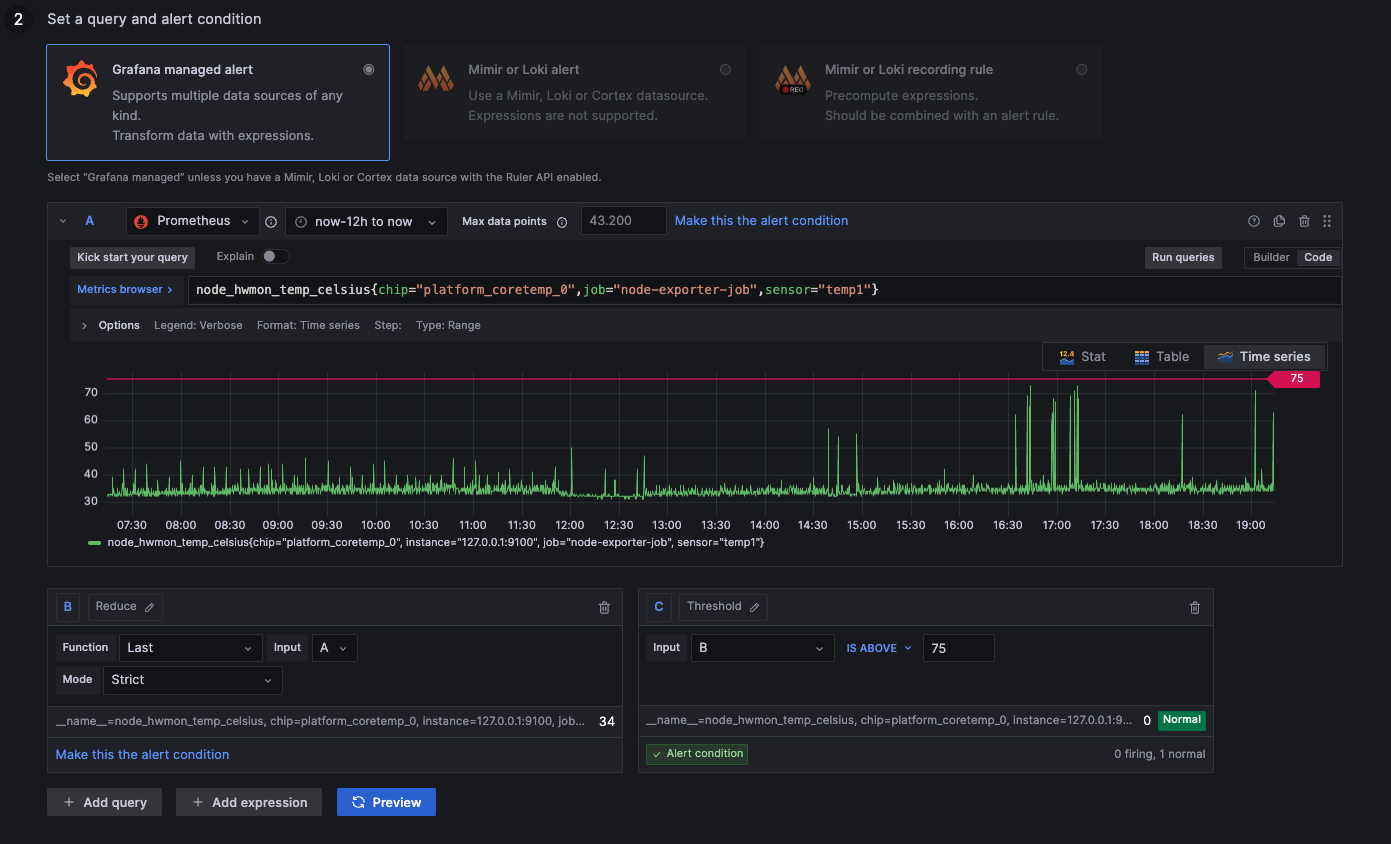
node_hwmon_temp_celsius{chip="platform_coretemp_0",job="node-exporter-job",sensor="temp1"}
Google Ping above 30ms
above 0,03: Connection takes longer than 30ms, not ideal
below 0,03: Connection takes less than 30ms, everything alright
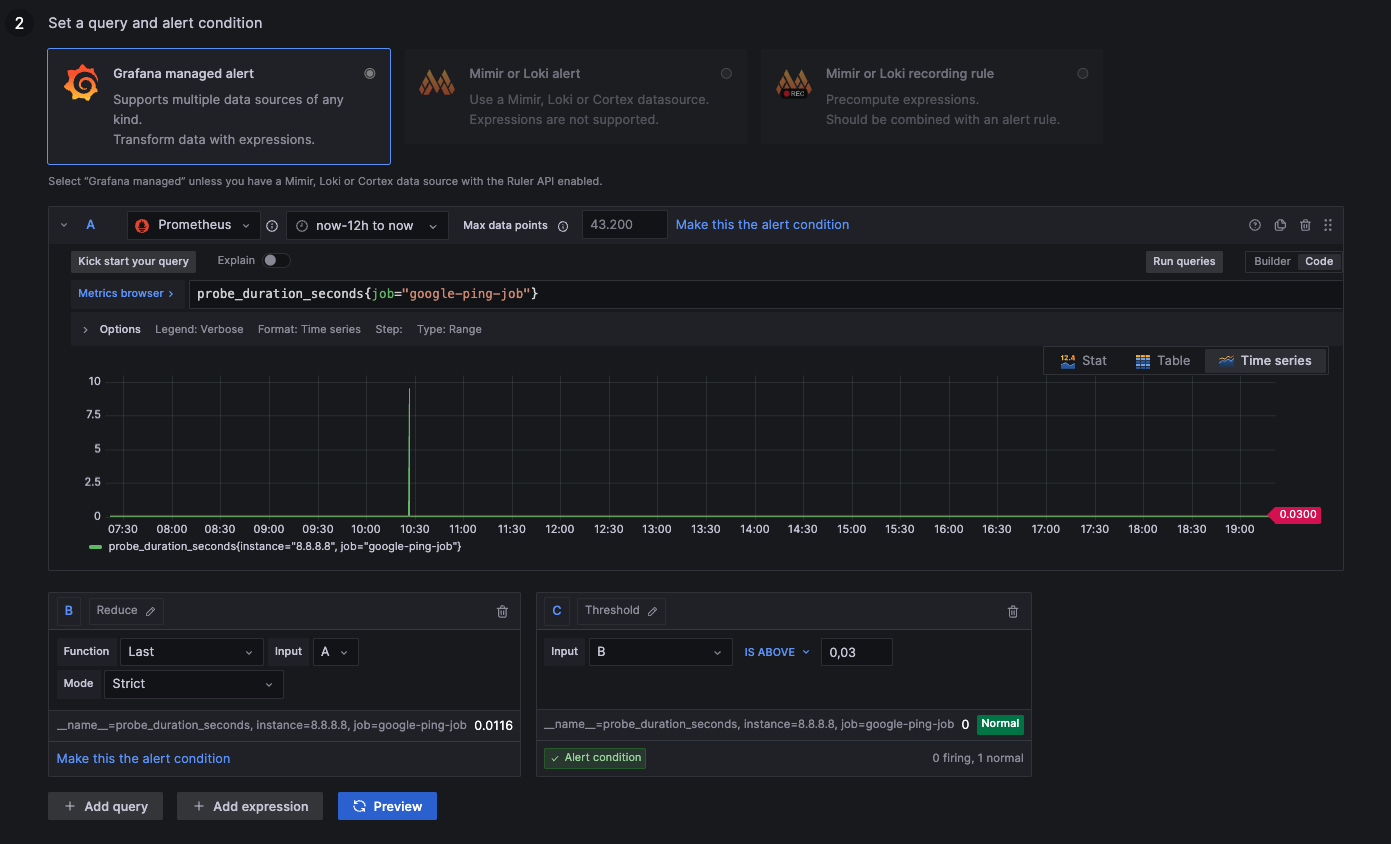
probe_duration_seconds{job="google-ping-job"}
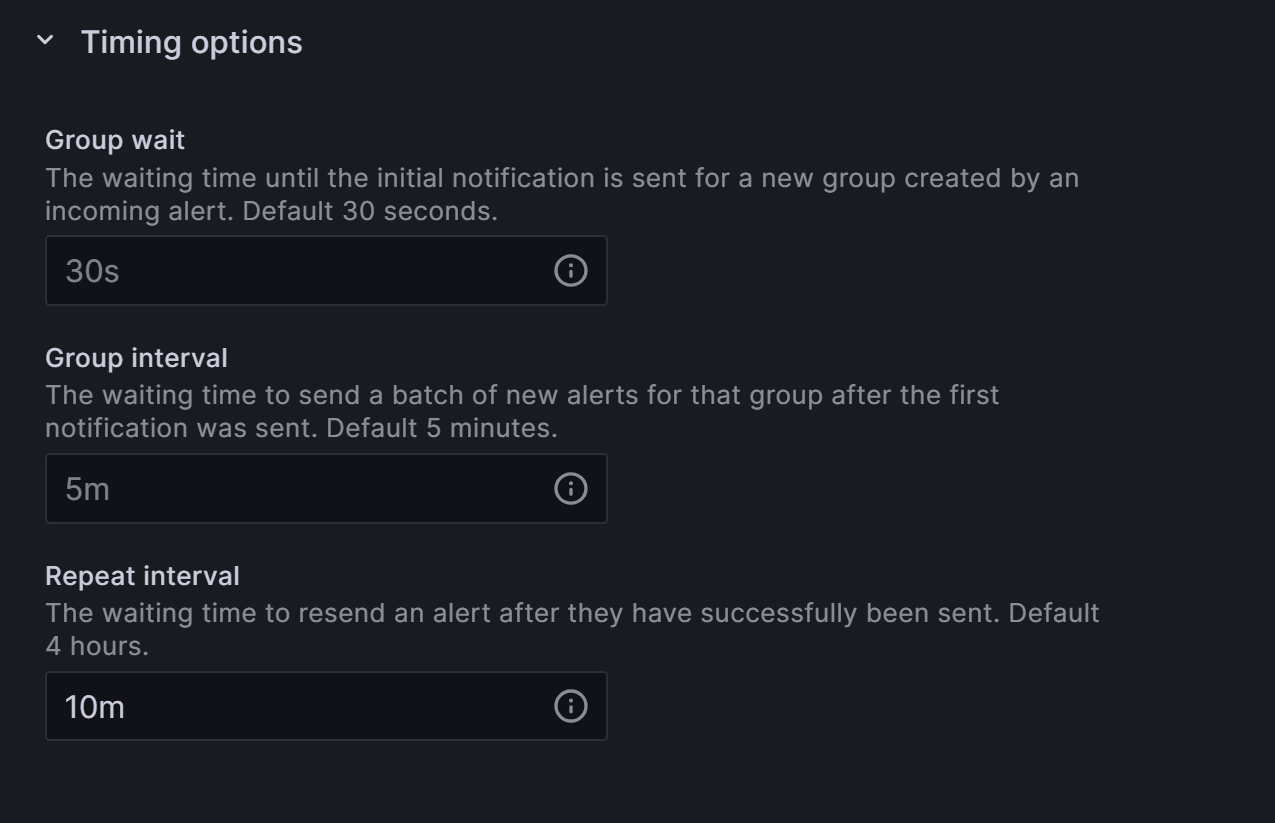
8.1.8 Configuring Notfication Intervals
- Head over to the
Alertingsection on the left menu. - Click on
Notification policies. - Click the 3-dot-menu on the default notification channel.
- Choose
Editwithin the popup. - Expand the
Timing Optionsfield
The window should look similar to this one, to send one notification every 5 minutes and refresh existing errors every 10 minutes. Grafana 9 will also send you and resolved message if the alarm is not present anymore.